
-
Search Options
- Cross Program
- Air
-
Wastewater/Stormwater/Biosolids (CWA)
- Wastewater/Stormwater/Biosolids Facility Search
- Biosolids Facility Search
- Biosolids Annual Report Search
- Industrial Stormwater Facility Search
- Map Water Facilities
- Water Pollutant Loading Tool
- NPDES DMR Non-Receipt Status Search
- Quarterly NPDES Noncompliance Report Search
- NPDES Noncompliance Annual Report
- Hazardous Waste
- Drinking Water
- Analyze Trends
- Find EPA Cases
- Data Services
- Help
Effluent Charts
 Help
Help
| Compliance Tracking: |
![]() Download Summary Data
Download Summary Data
![]() Download All Data
Click a cell in the summary grid to display the effluent chart(s). By default the last three years of data are presented.
Download All Data
Click a cell in the summary grid to display the effluent chart(s). By default the last three years of data are presented.
Use the controls above to modify the date range, view charts for a different NPDES ID and/or filter by compliance status.
No discharge monitoring report (DMR) data available for this permit and date range.

Error reporting links are now available next to each table and chart. Please click these links to report errors.
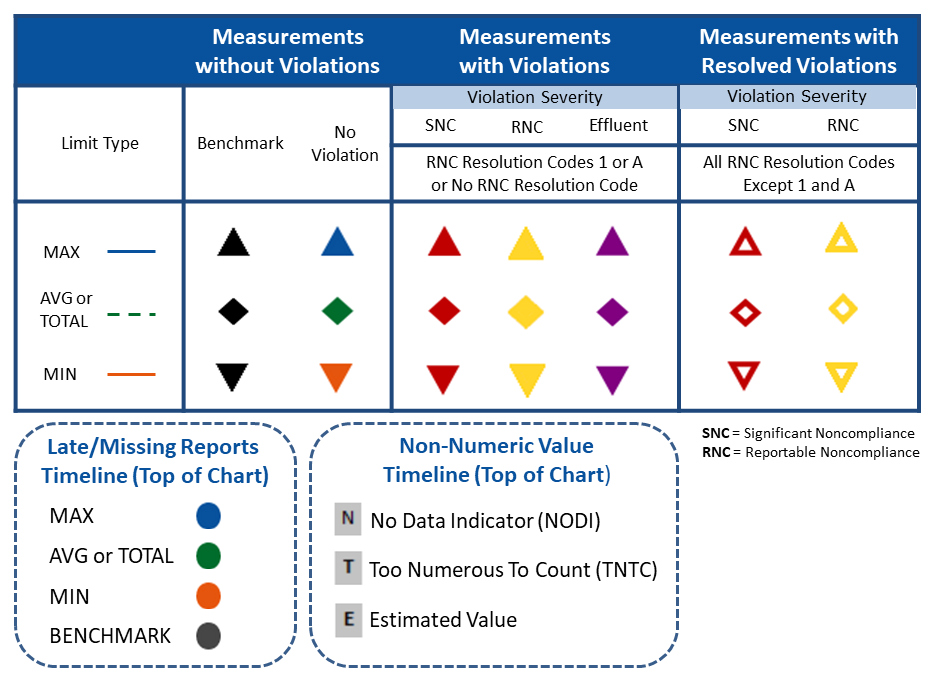
Effluent charts present an interactive display of effluent measures, permitted limits, and effluent violations for a specified date range for a single permit, discharge point, pollutant, monitoring location, and sampling period.
- Chart symbols identify the measurement's statistical basis and change color if the measurement is in violation of the effluent limit.
- Hover your mouse pointer over any data point or limit line to view an attribute bubble containing the measurement or limit value.
- Use the chart legend shown below the chart to control which data series are shown on the chart. Click to enable (or disable) the data series displayed.
- Using your mouse pointer, drag out a rectangle in the chart. The chart will adjust to zoom into the selected area. Click "Reset zoom" to return to the default chart view.