
Data Visualization Gallery Help
On this page:
How to Use Qlik
In Qlik, any selections you make will affect every other graphic in the application. All selections which have previously been made by the user will appear in the selection bar at the top of the dashboard.
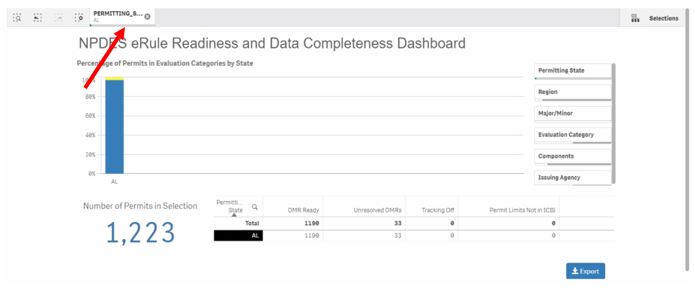
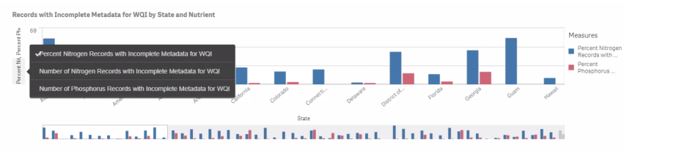
You can use ‘filters’ or simply click on the aspect of the data that you are interested in (for example, one row from a table, as shown in the image below) to adjust your selections and drill down into the data included in the charts. Notice that the selection bar on top of the page includes the selected state.
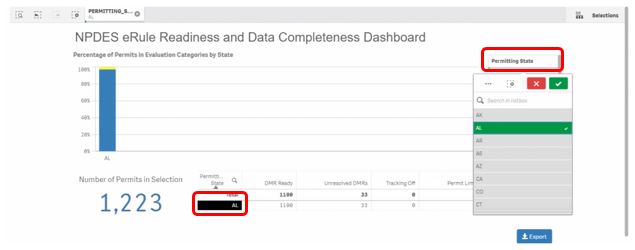
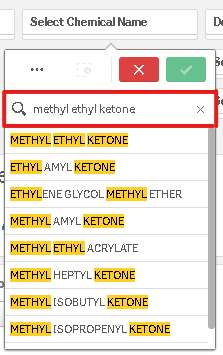
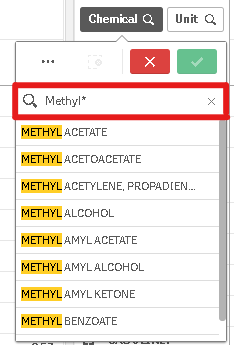
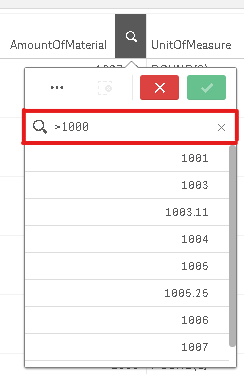
You can also search 'inside' of filters and tables. Click on the filter or table column you are interested in (see the image below) and enter your keyword(s) or numeric value(s). String searches and numeric searches are matched in the field value and only returns values that fulfill the requirements. Learn more about searching Qlik features and adding modifiers to your keywords in this Qlik Sense cheat sheet (PDF) (1 p, 658 K).
Some charts will have toggles, which allow for users to view the data differently (e.g., switch from viewing counts to percentages). These can be on either the X or Y axis, or both.
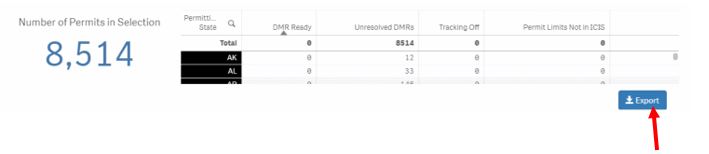
To download any chart or table, simply click on the ‘export’ button below the chart.
Background
The Data Visualization Gallery provides an exciting new way for ECHO to display data used for data quality assurance, integration, and analytics. This page showcases compliance-related dashboards created by Qlik users across EPA. The data visualization dashboards are interactive and allow users to filter, drill-down into, and navigate the underlying data.
Featured products are presented first. You can quickly find products of interest by filtering on Media and/or Owner Affiliation. You can also search for products by using the 'Keywords' search functionality. By default, filters are set to No Restrictions.
Users may provide comments on individual dashboards by using the 'Provide Feedback' button located next to each visualization. As the page is new and still being developed, we encourage all feedback and comments.