
Hypoxia Task Force Search Help
The Mississippi River/Gulf of Mexico Watershed Nutrient Task Force was established in the fall of 1997 to understand the causes and effects of eutrophication in the Gulf of Mexico; coordinate activities to reduce the size, severity, and duration; and ameliorate the effects of hypoxia. Activities include coordinating and supporting nutrient management activities from all sources, restoring habitats to trap and assimilate nutrients, and supporting other hypoxia related activities in the Mississippi River and Gulf of Mexico watersheds.
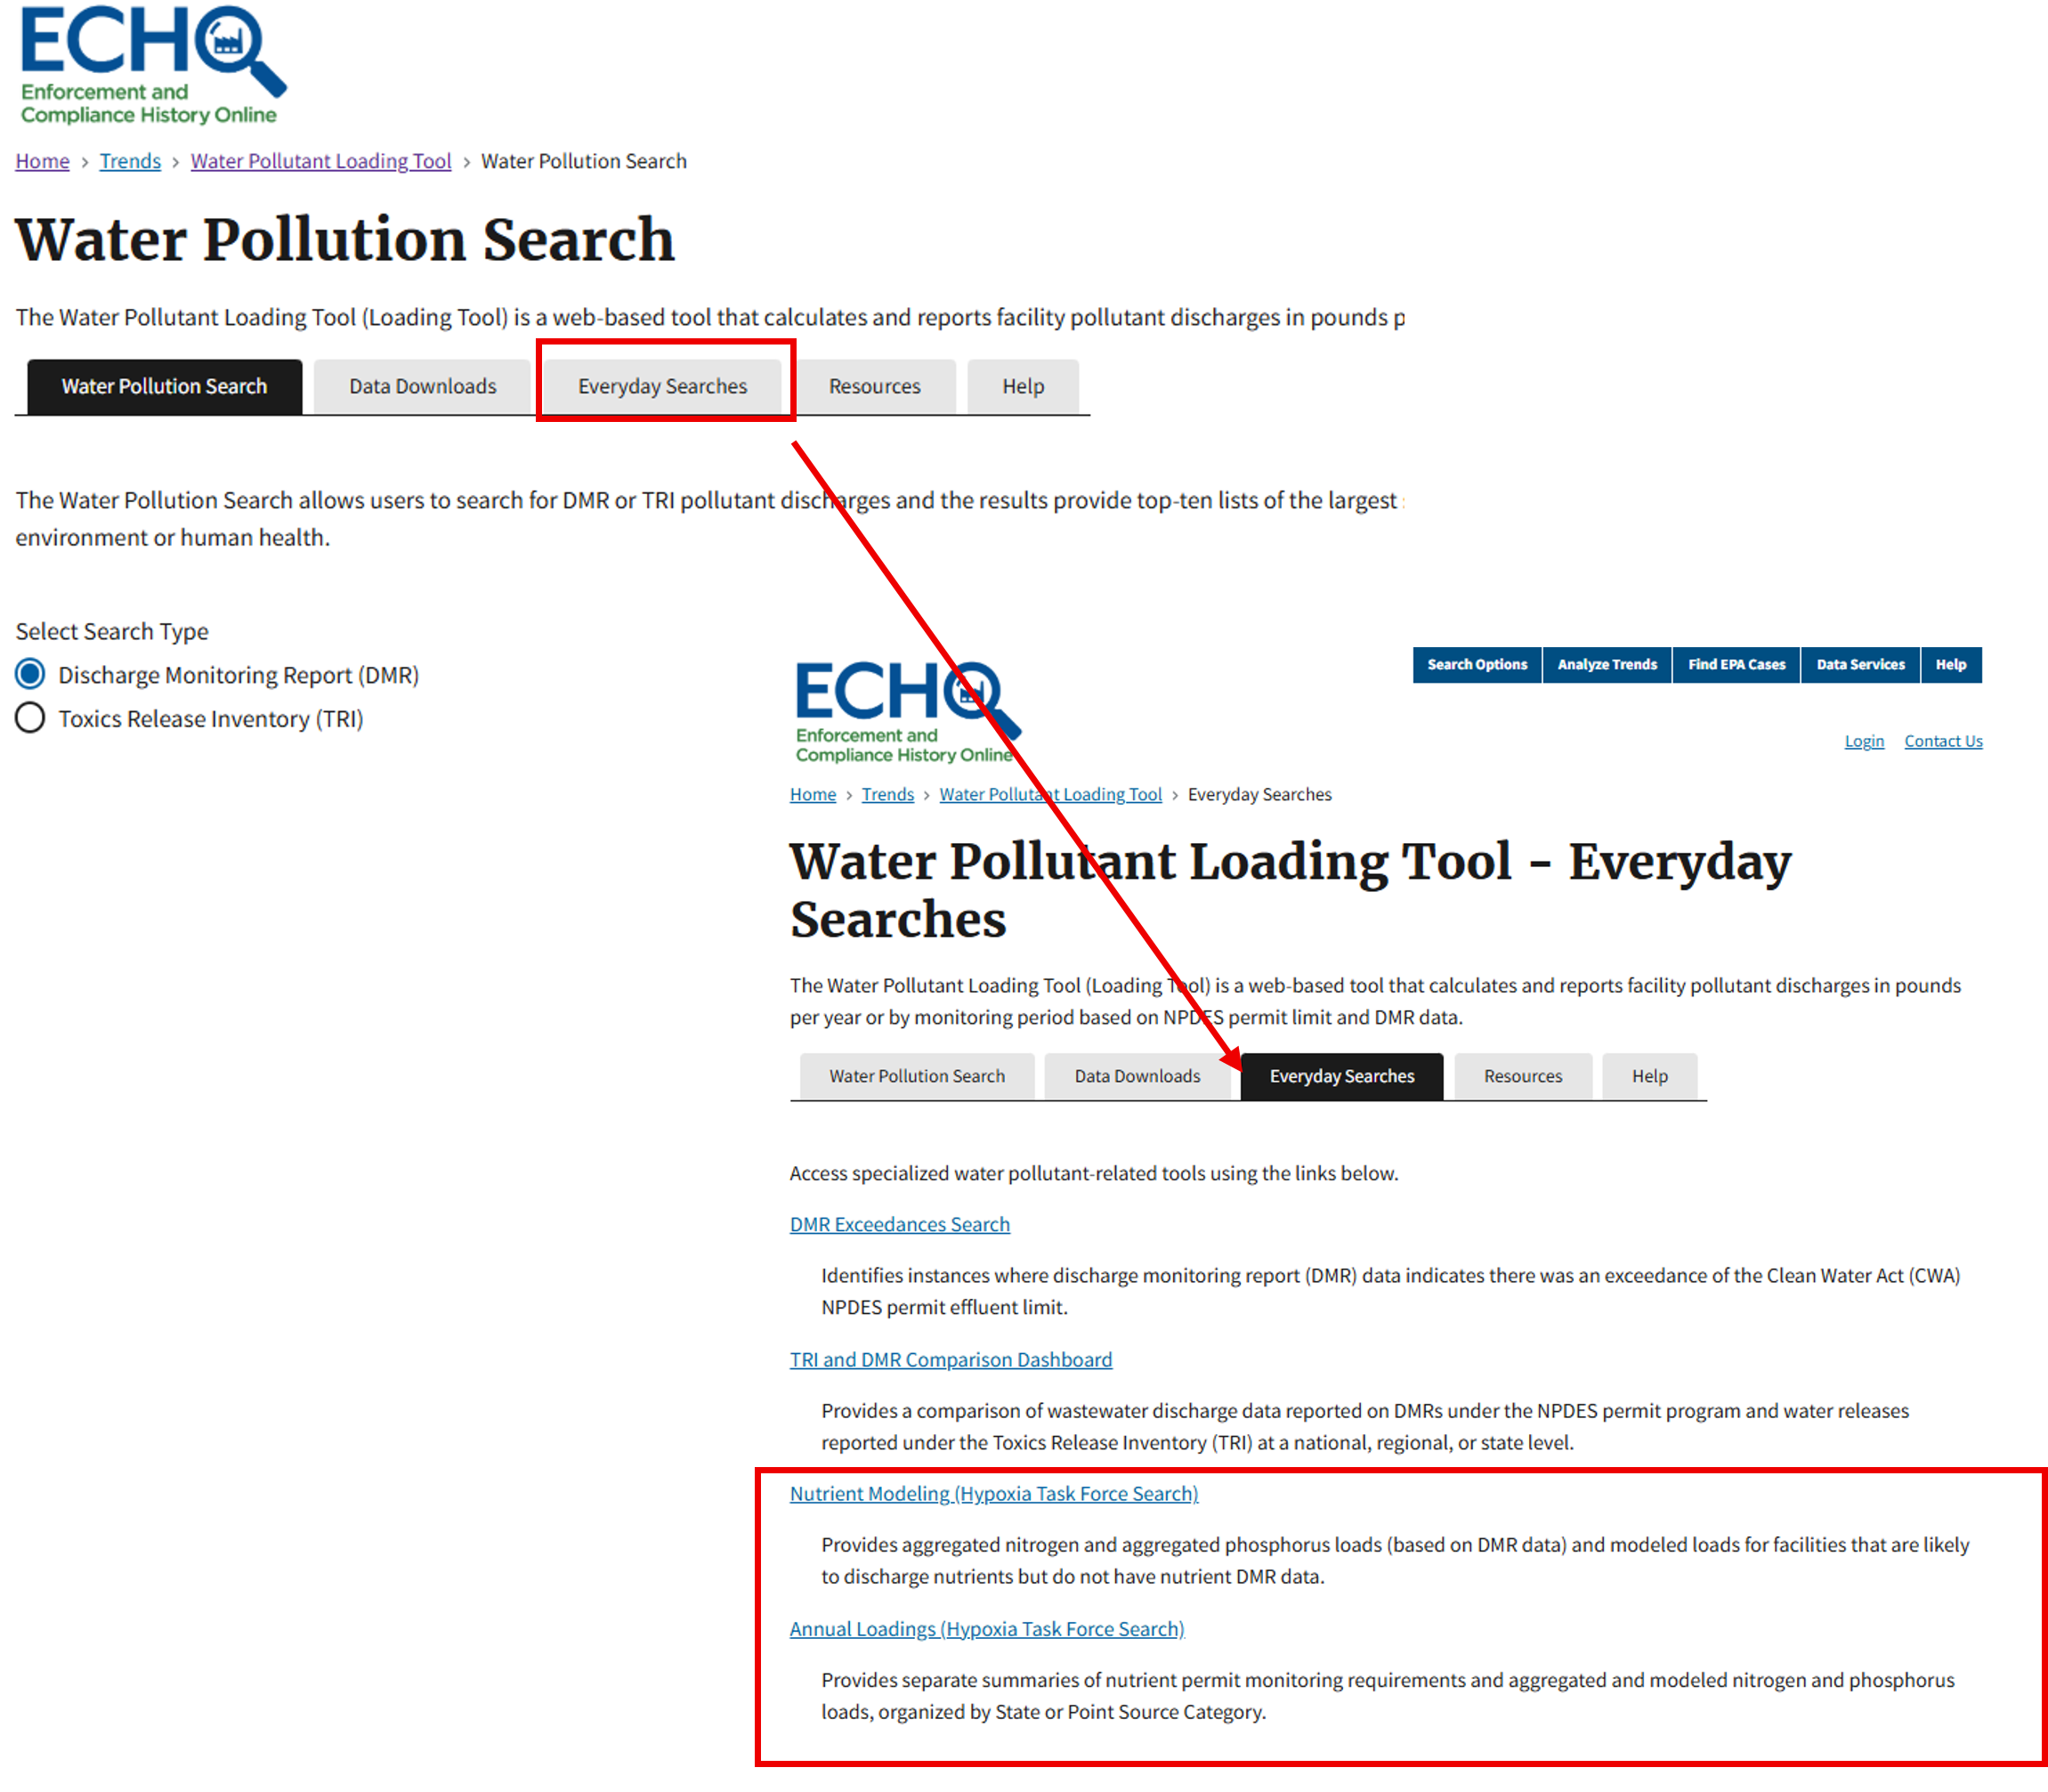
EPA developed two Hypoxia Task Force (HTF) search features for the Water Pollutant Loading Tool to facilitate discussions among Mississippi River/Gulf of Mexico Watershed states about nutrient pollution: Nutrient Modeling Search and Annual Loadings. These searches allow users to see nutrient pollution from point sources. The two searches and results are limited to nitrogen and phosphorus data and are located on the ‘Everyday Searches’ tab of the Loading Tool.
HTF Nutrient Modeling Search
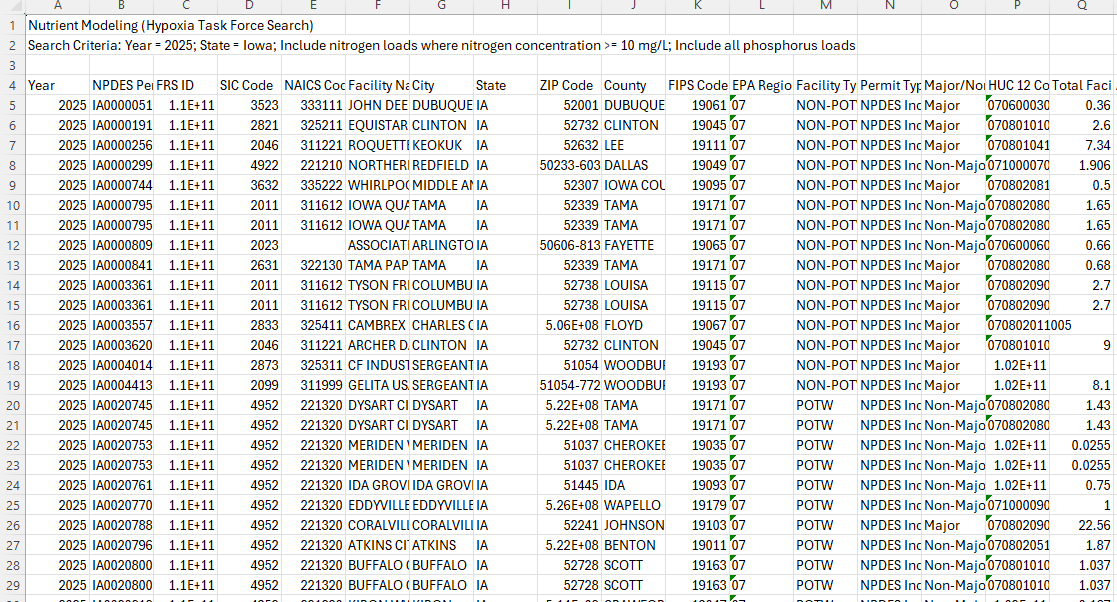
The HTF Nutrient Modeling search provides facility totals for aggregated nitrogen and aggregated phosphorus loads. The search includes nutrient loads calculated using Discharge Monitoring Report (DMR) data as well as modeled nutrient loads for facilities that are likely to discharge Nitrogen and/or Phosphorus, but do not report Nitrogen or Phosphorus discharges on their DMRs. This model was based on the USGS model and was reviewed by USGS prior to deployment. A complete description of this model is provided at “About the Nutrient Model”. Search results can be downloaded to a CSV file. These results show the pollutant load for the selected year and whether it was based on DMR data or modeled from similar facilities using the Nutrient Model.
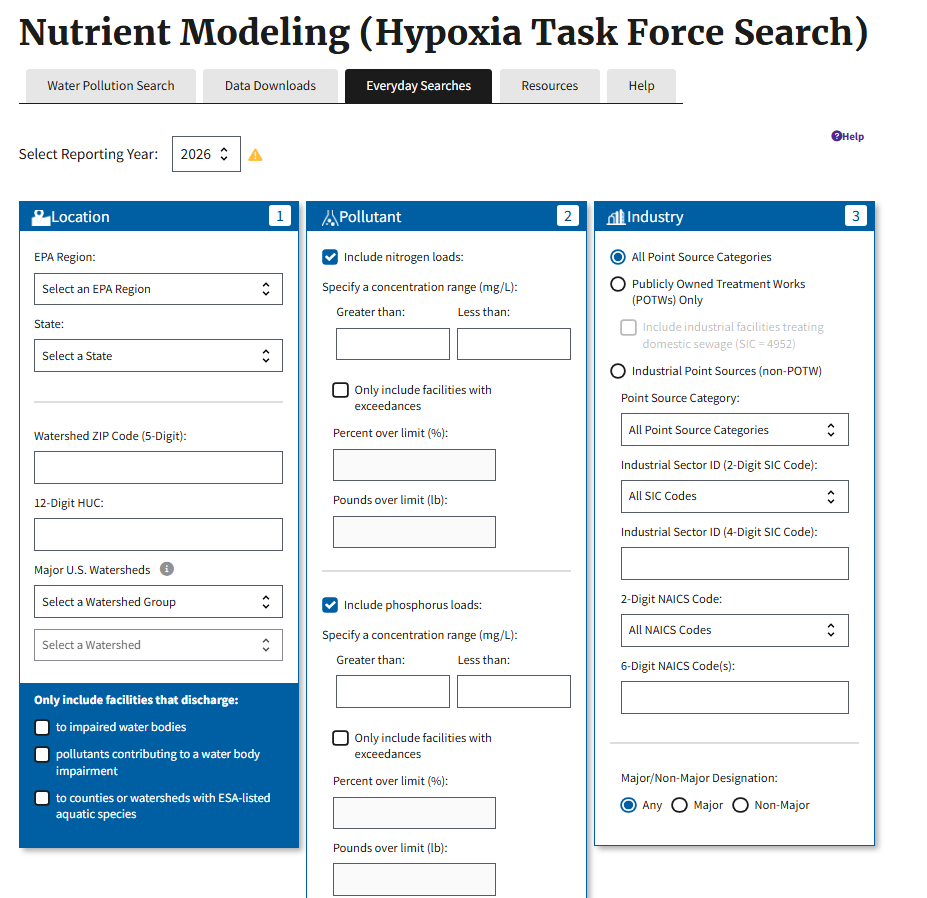
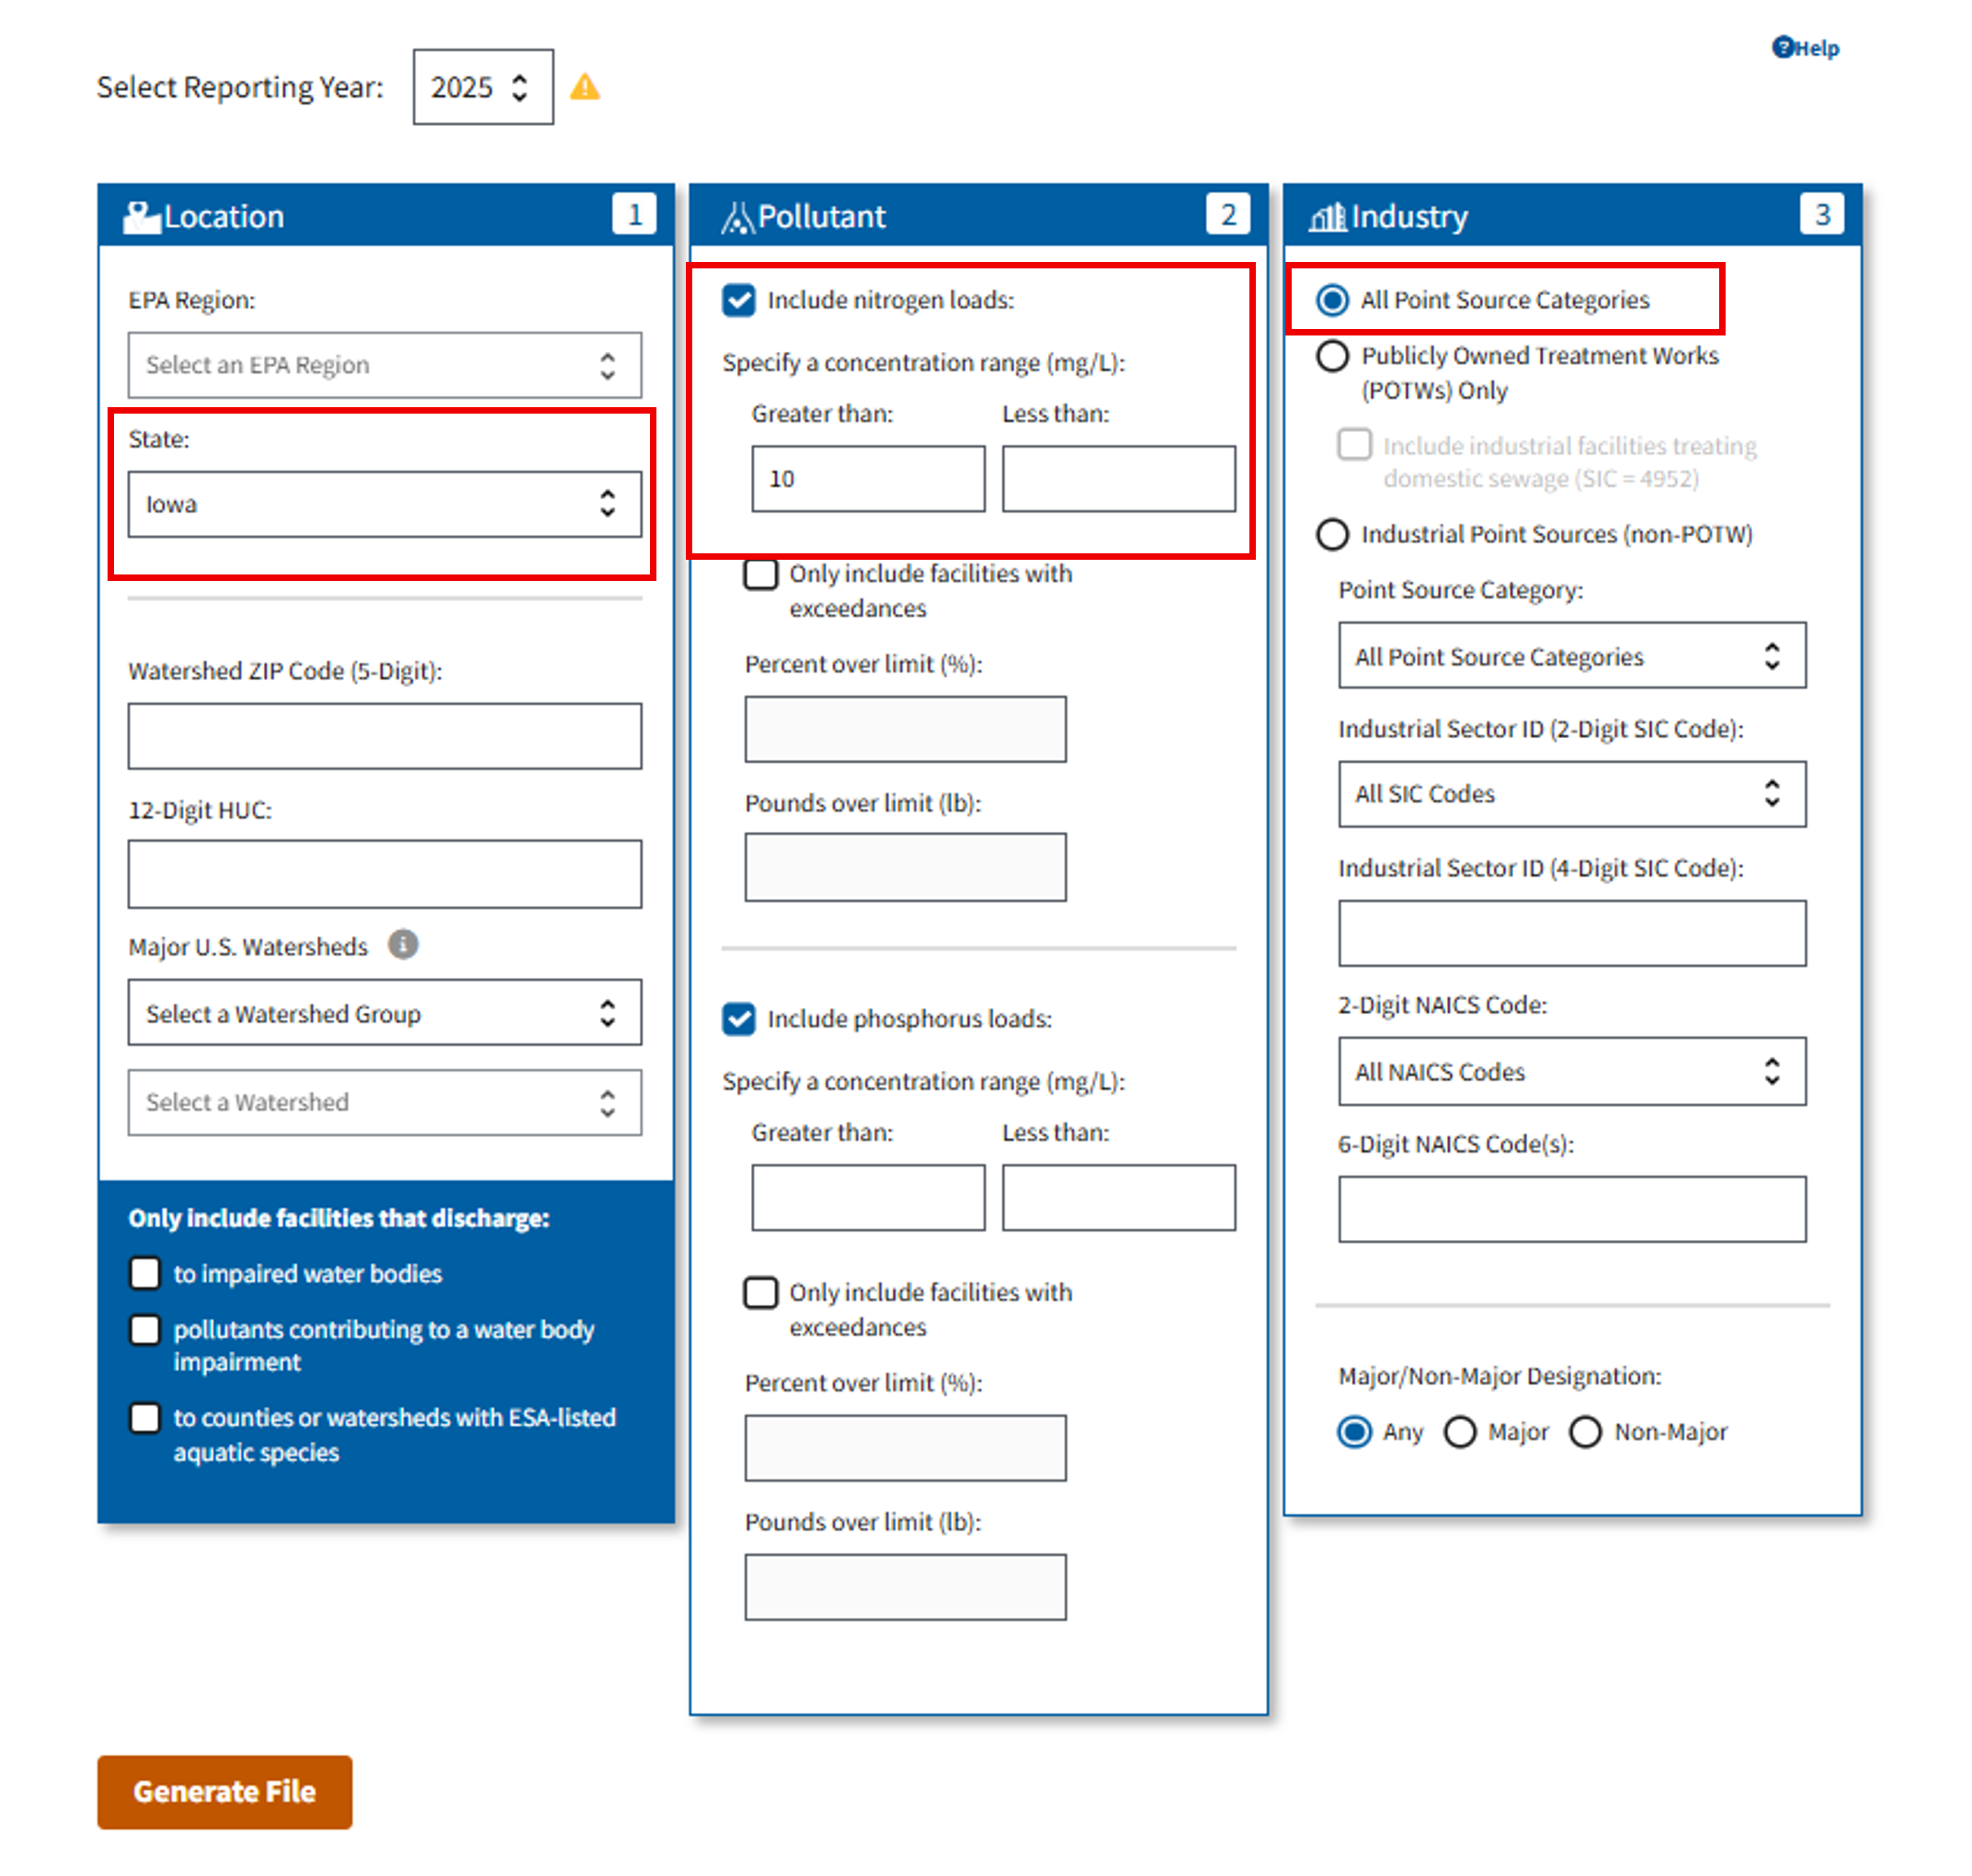
The following example search shows how to find nitrogen pollution for all facilities in Iowa discharging nitrogen compounds above 10 mg/L.
You can download the results from this search to your computer in a file that can be opened in a spreadsheet for further analysis.
HTF Annual Loadings Report
The Annual Loadings Report provides aggregated nitrogen and aggregated phosphorus loads summed by State or Point Source Category. Users may view Nitrogen and Phosphorus loads side by side for all facilities, or compare POTW and Non-POTW nitrogen or phosphorus loads. This search may also be used to generate statistics, by state or point source category, of facilities with permit limits and effluent monitoring requirements for nitrogen and phosphorus.
Users can make several selections to display data, including: Time period, Row Heading (State or Point Source Category), and Column Heading [Pollutant or Industry (POTW/non-POTW)].
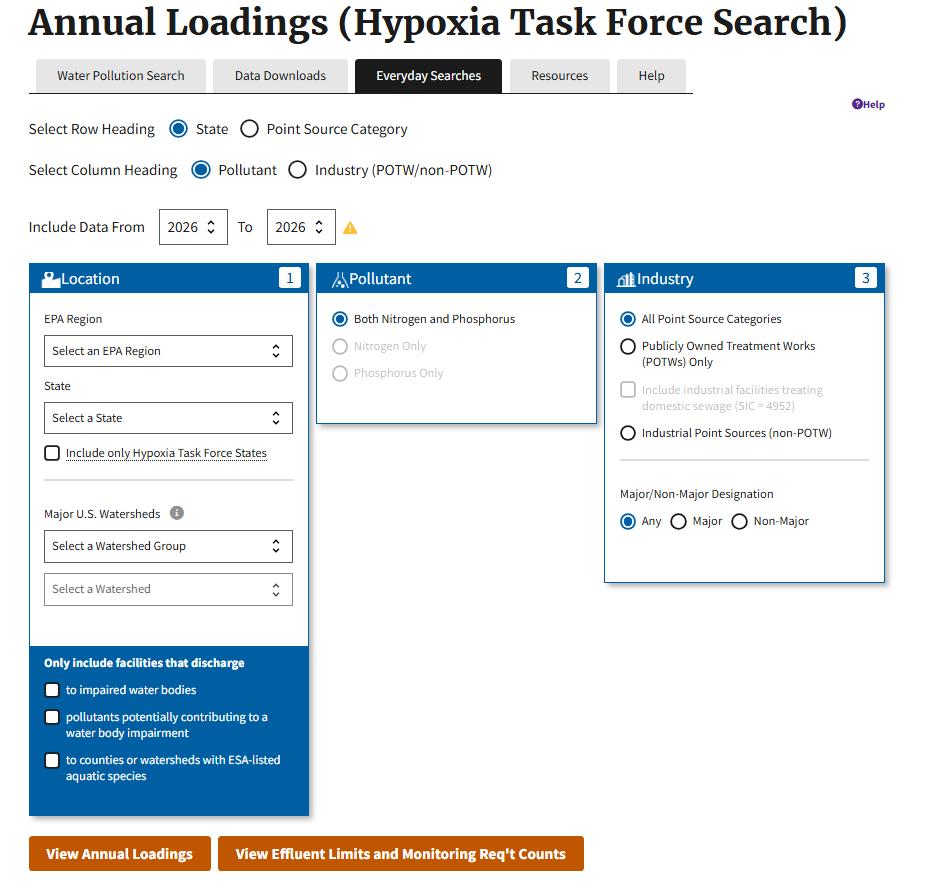
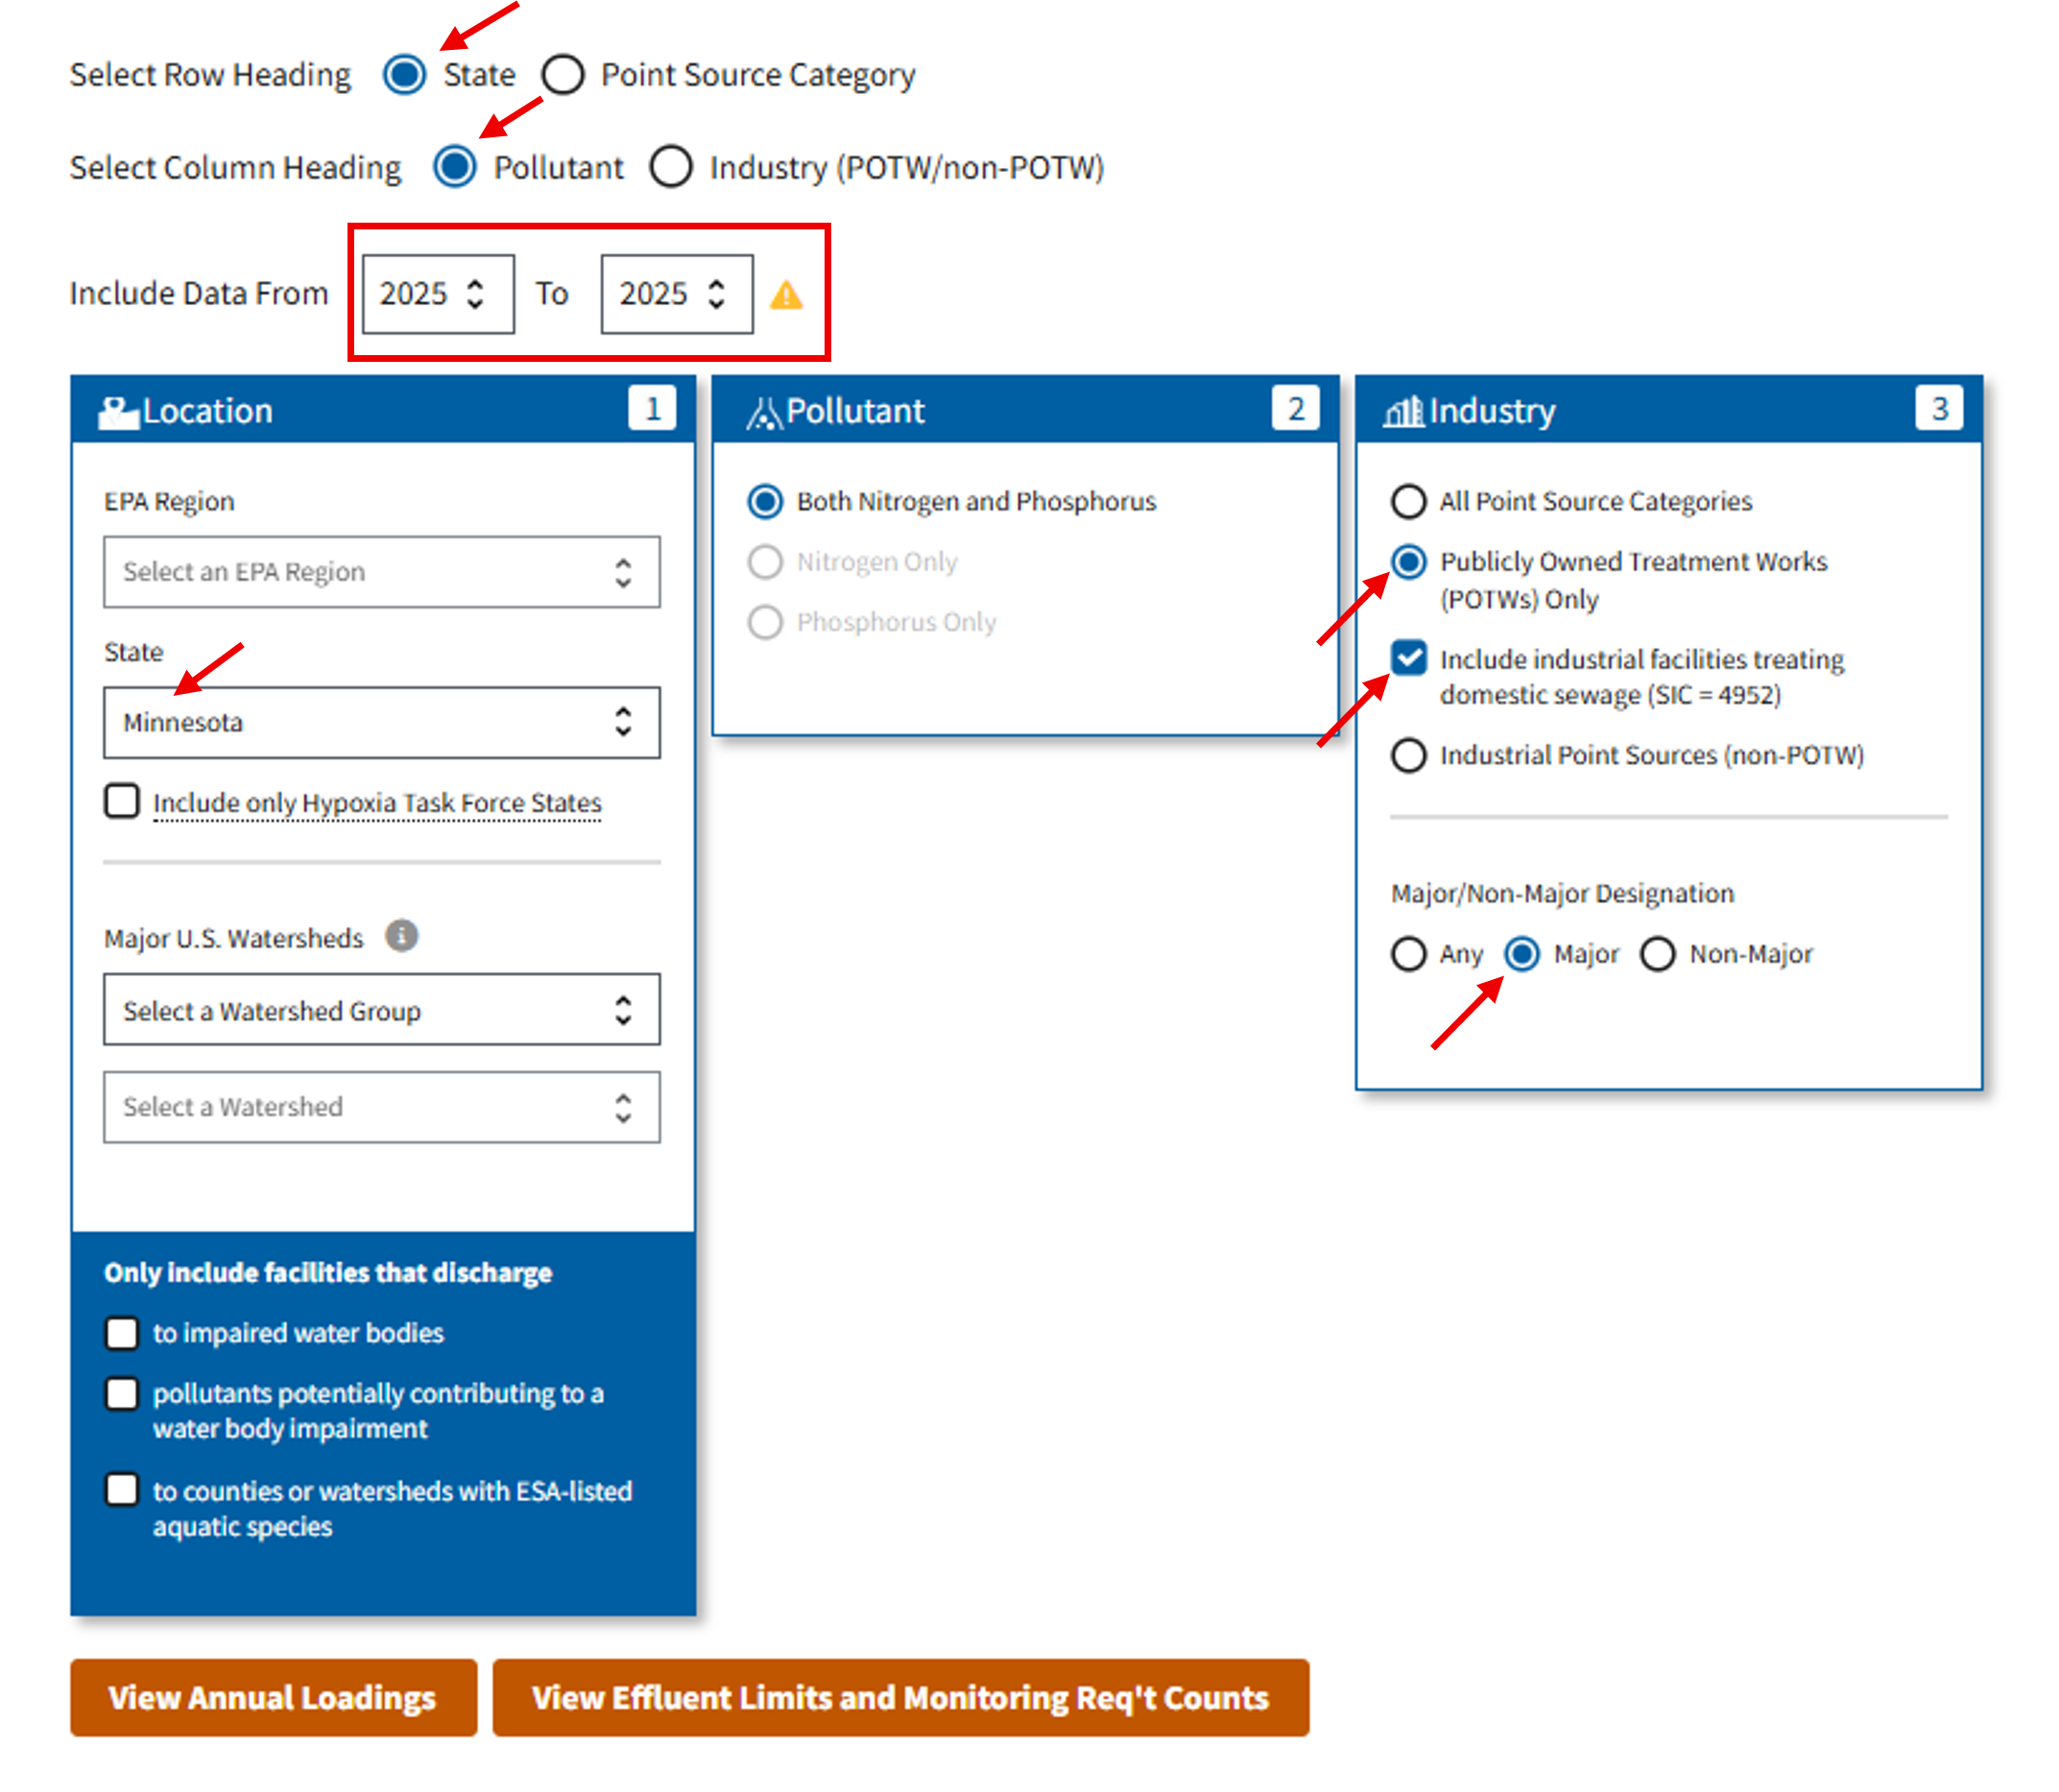
Option 1: "View Annual Loadings"
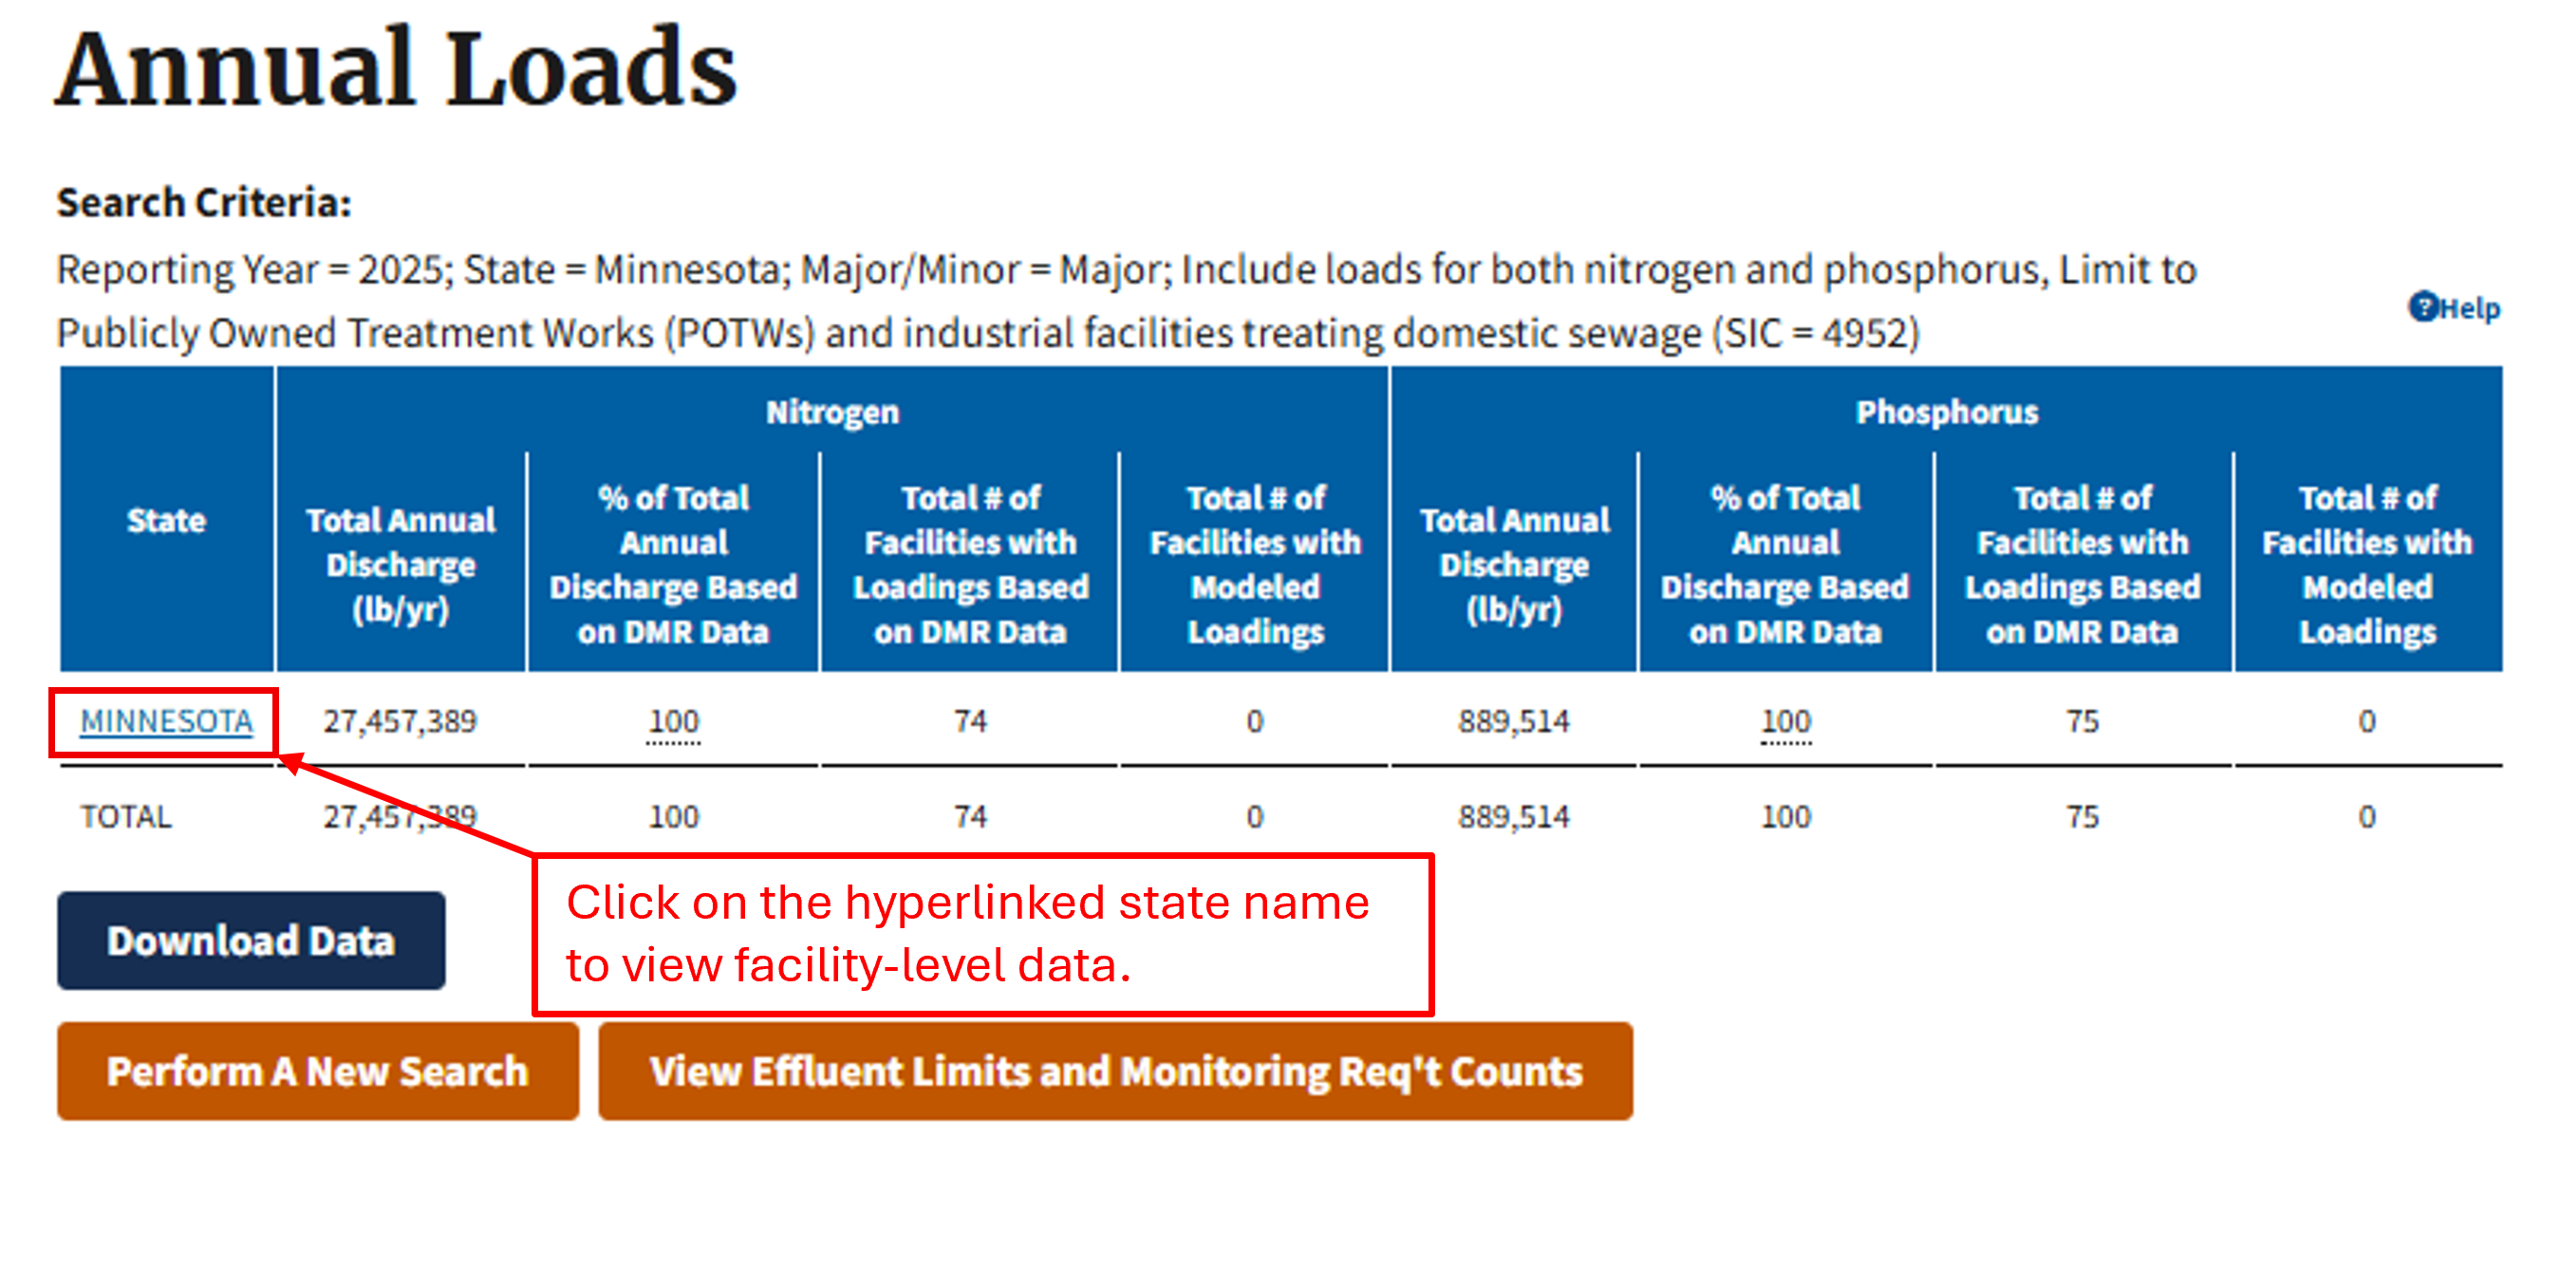
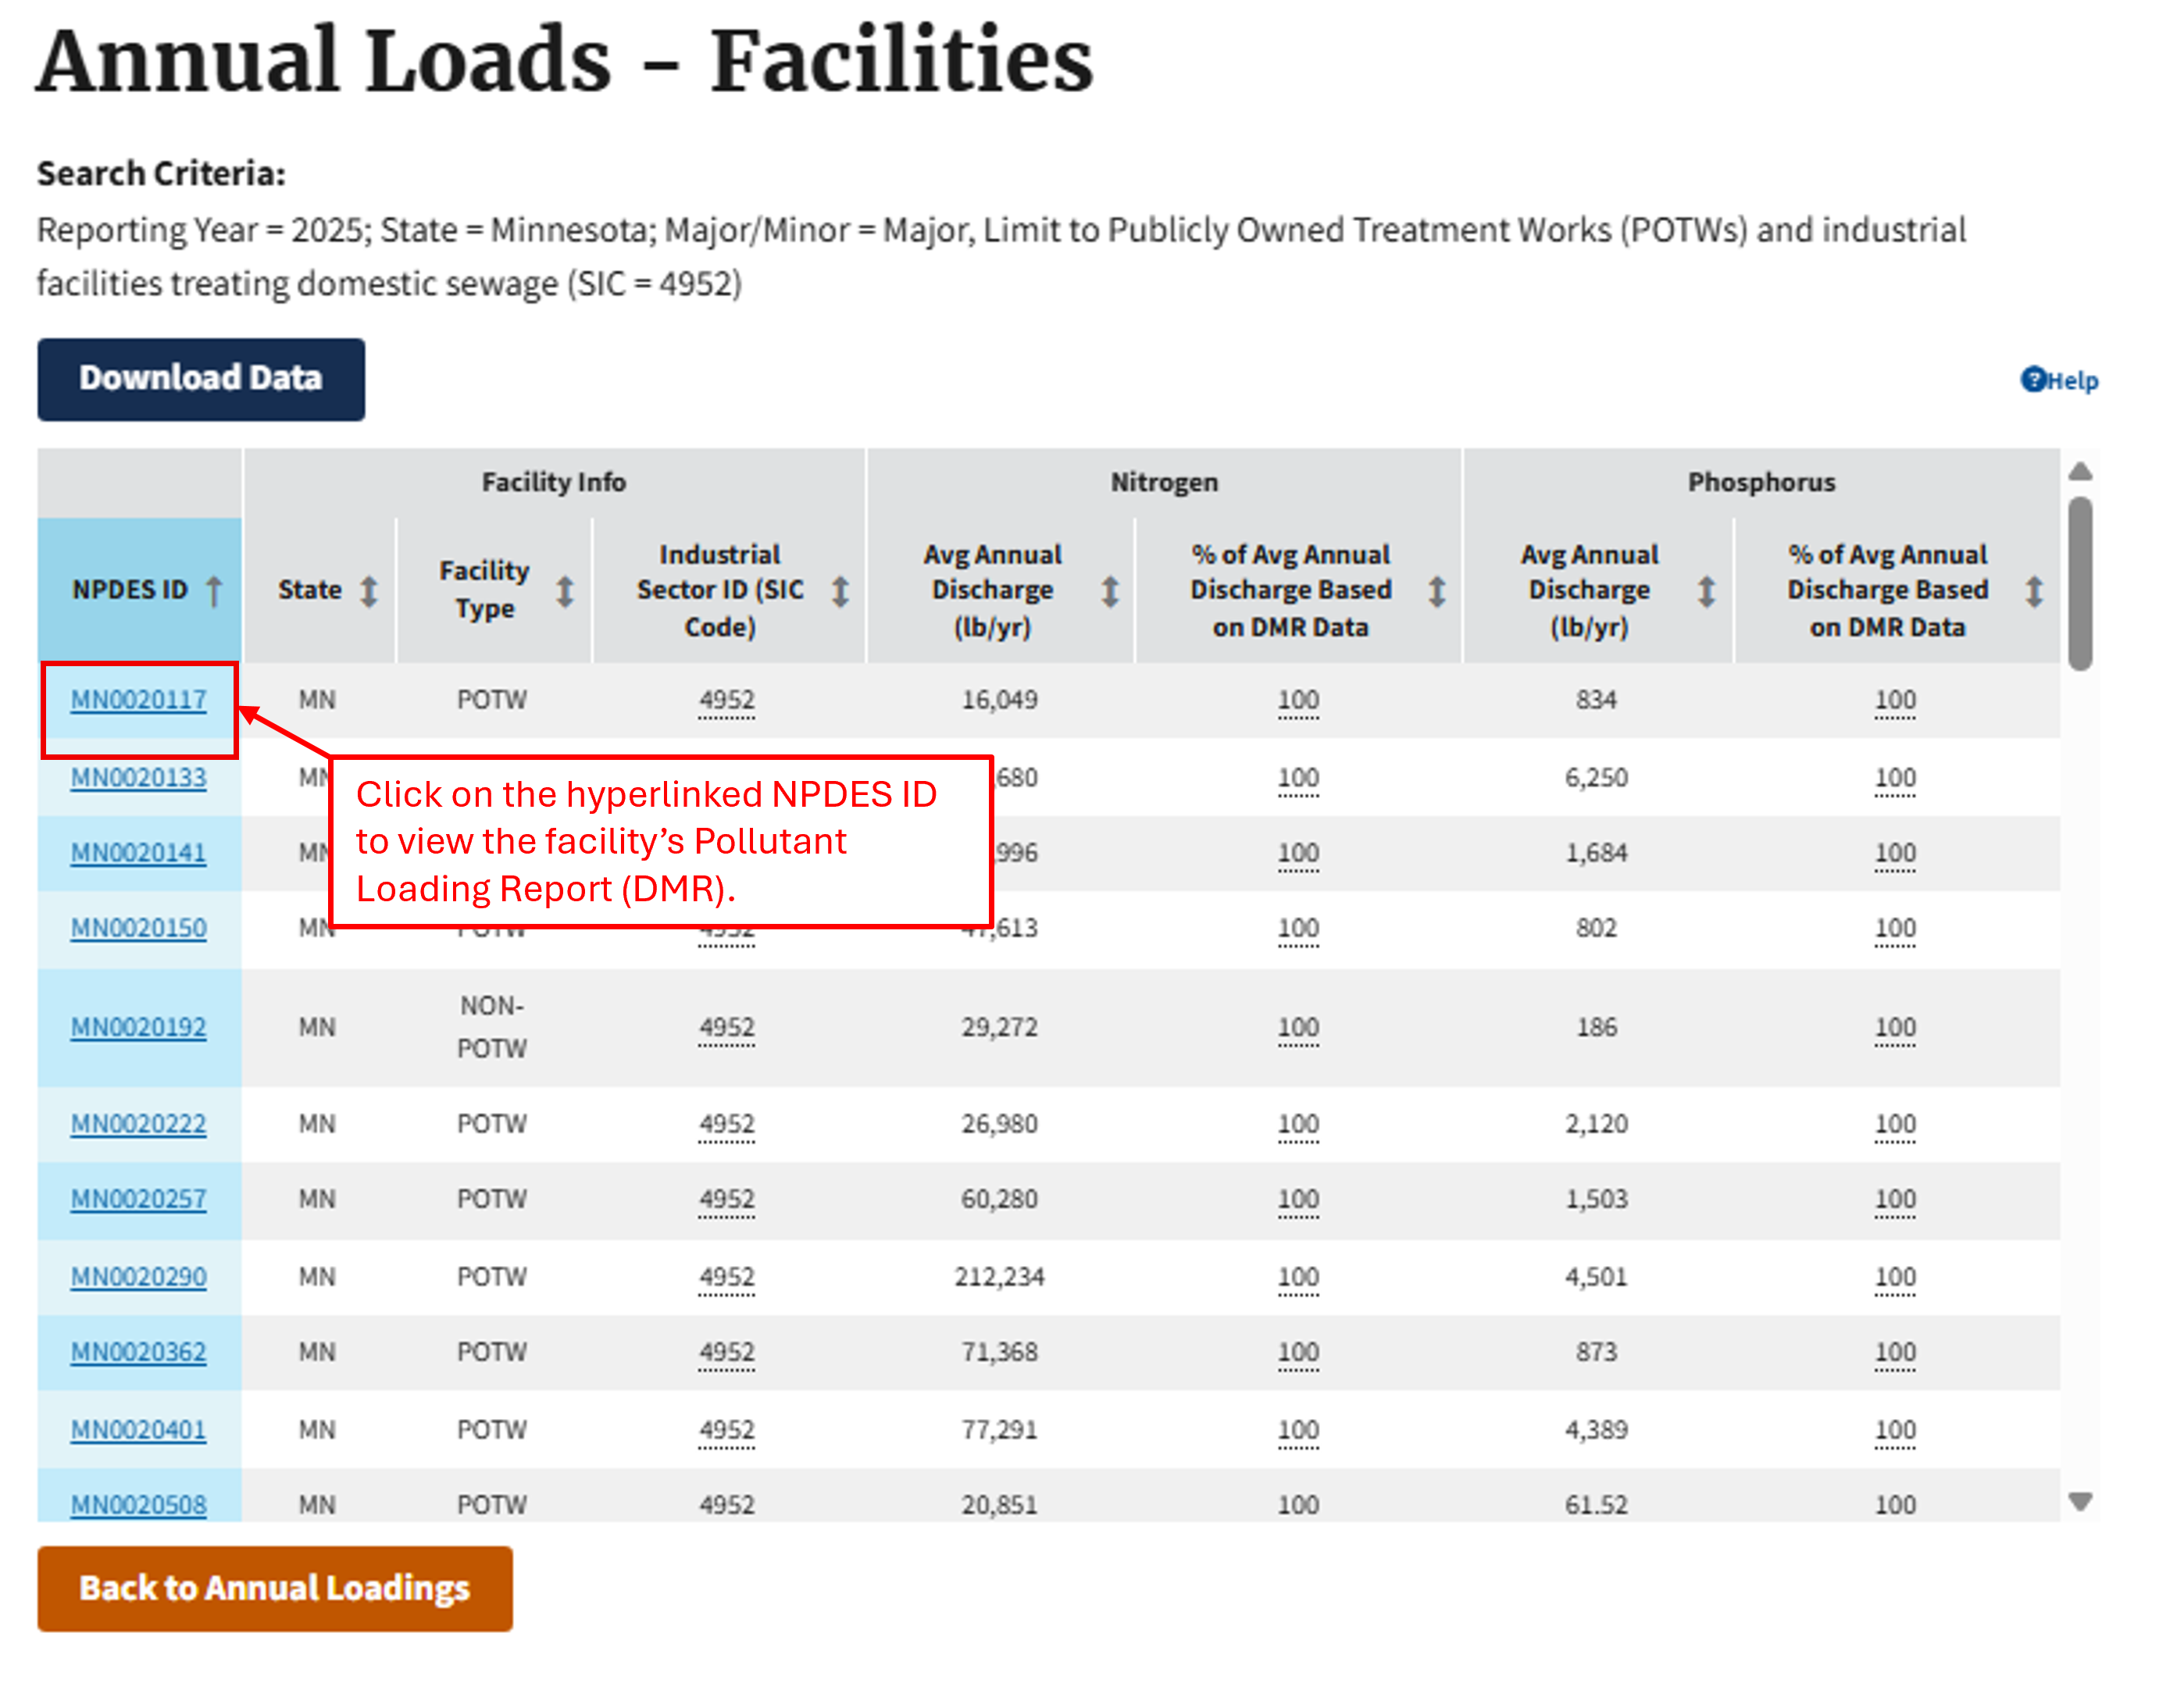
Users can make their selections and click on the “View Annual Loadings” button. This will return the total amount of nutrient discharges for a given state or industrial sector. For example, the following search will return the total amount of nitrogen and phosphorus discharges (in pounds) in 2025 for major facilities treating domestic sewage (SIC = 4952). The hyperlinked state name in the Annual Loads table allows users to drill down to facility-level data, where the hyperlinked NPDES ID provides access to each facility's Pollutant Loading Report (DMR).
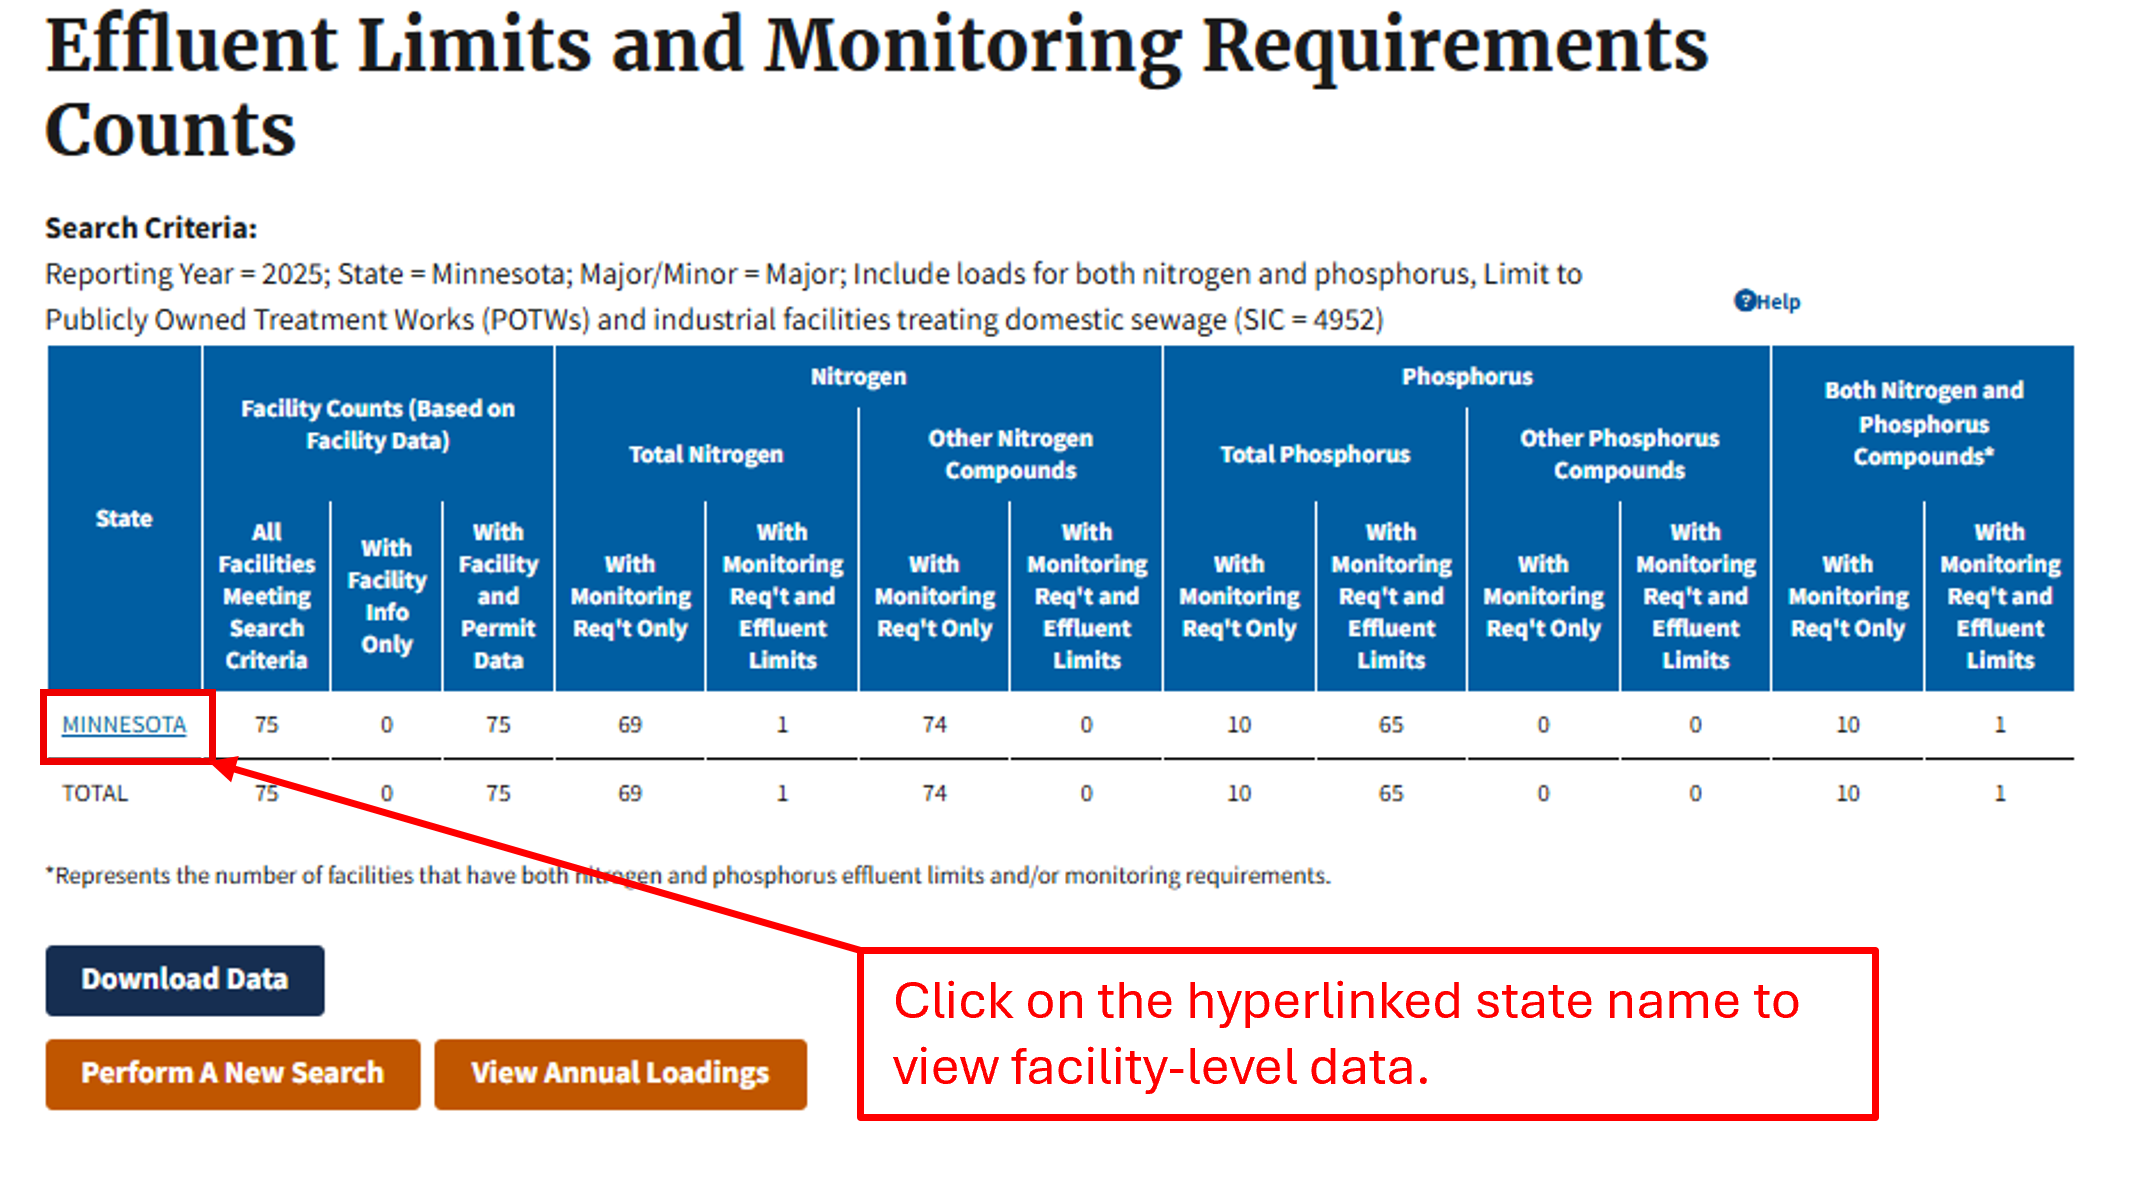
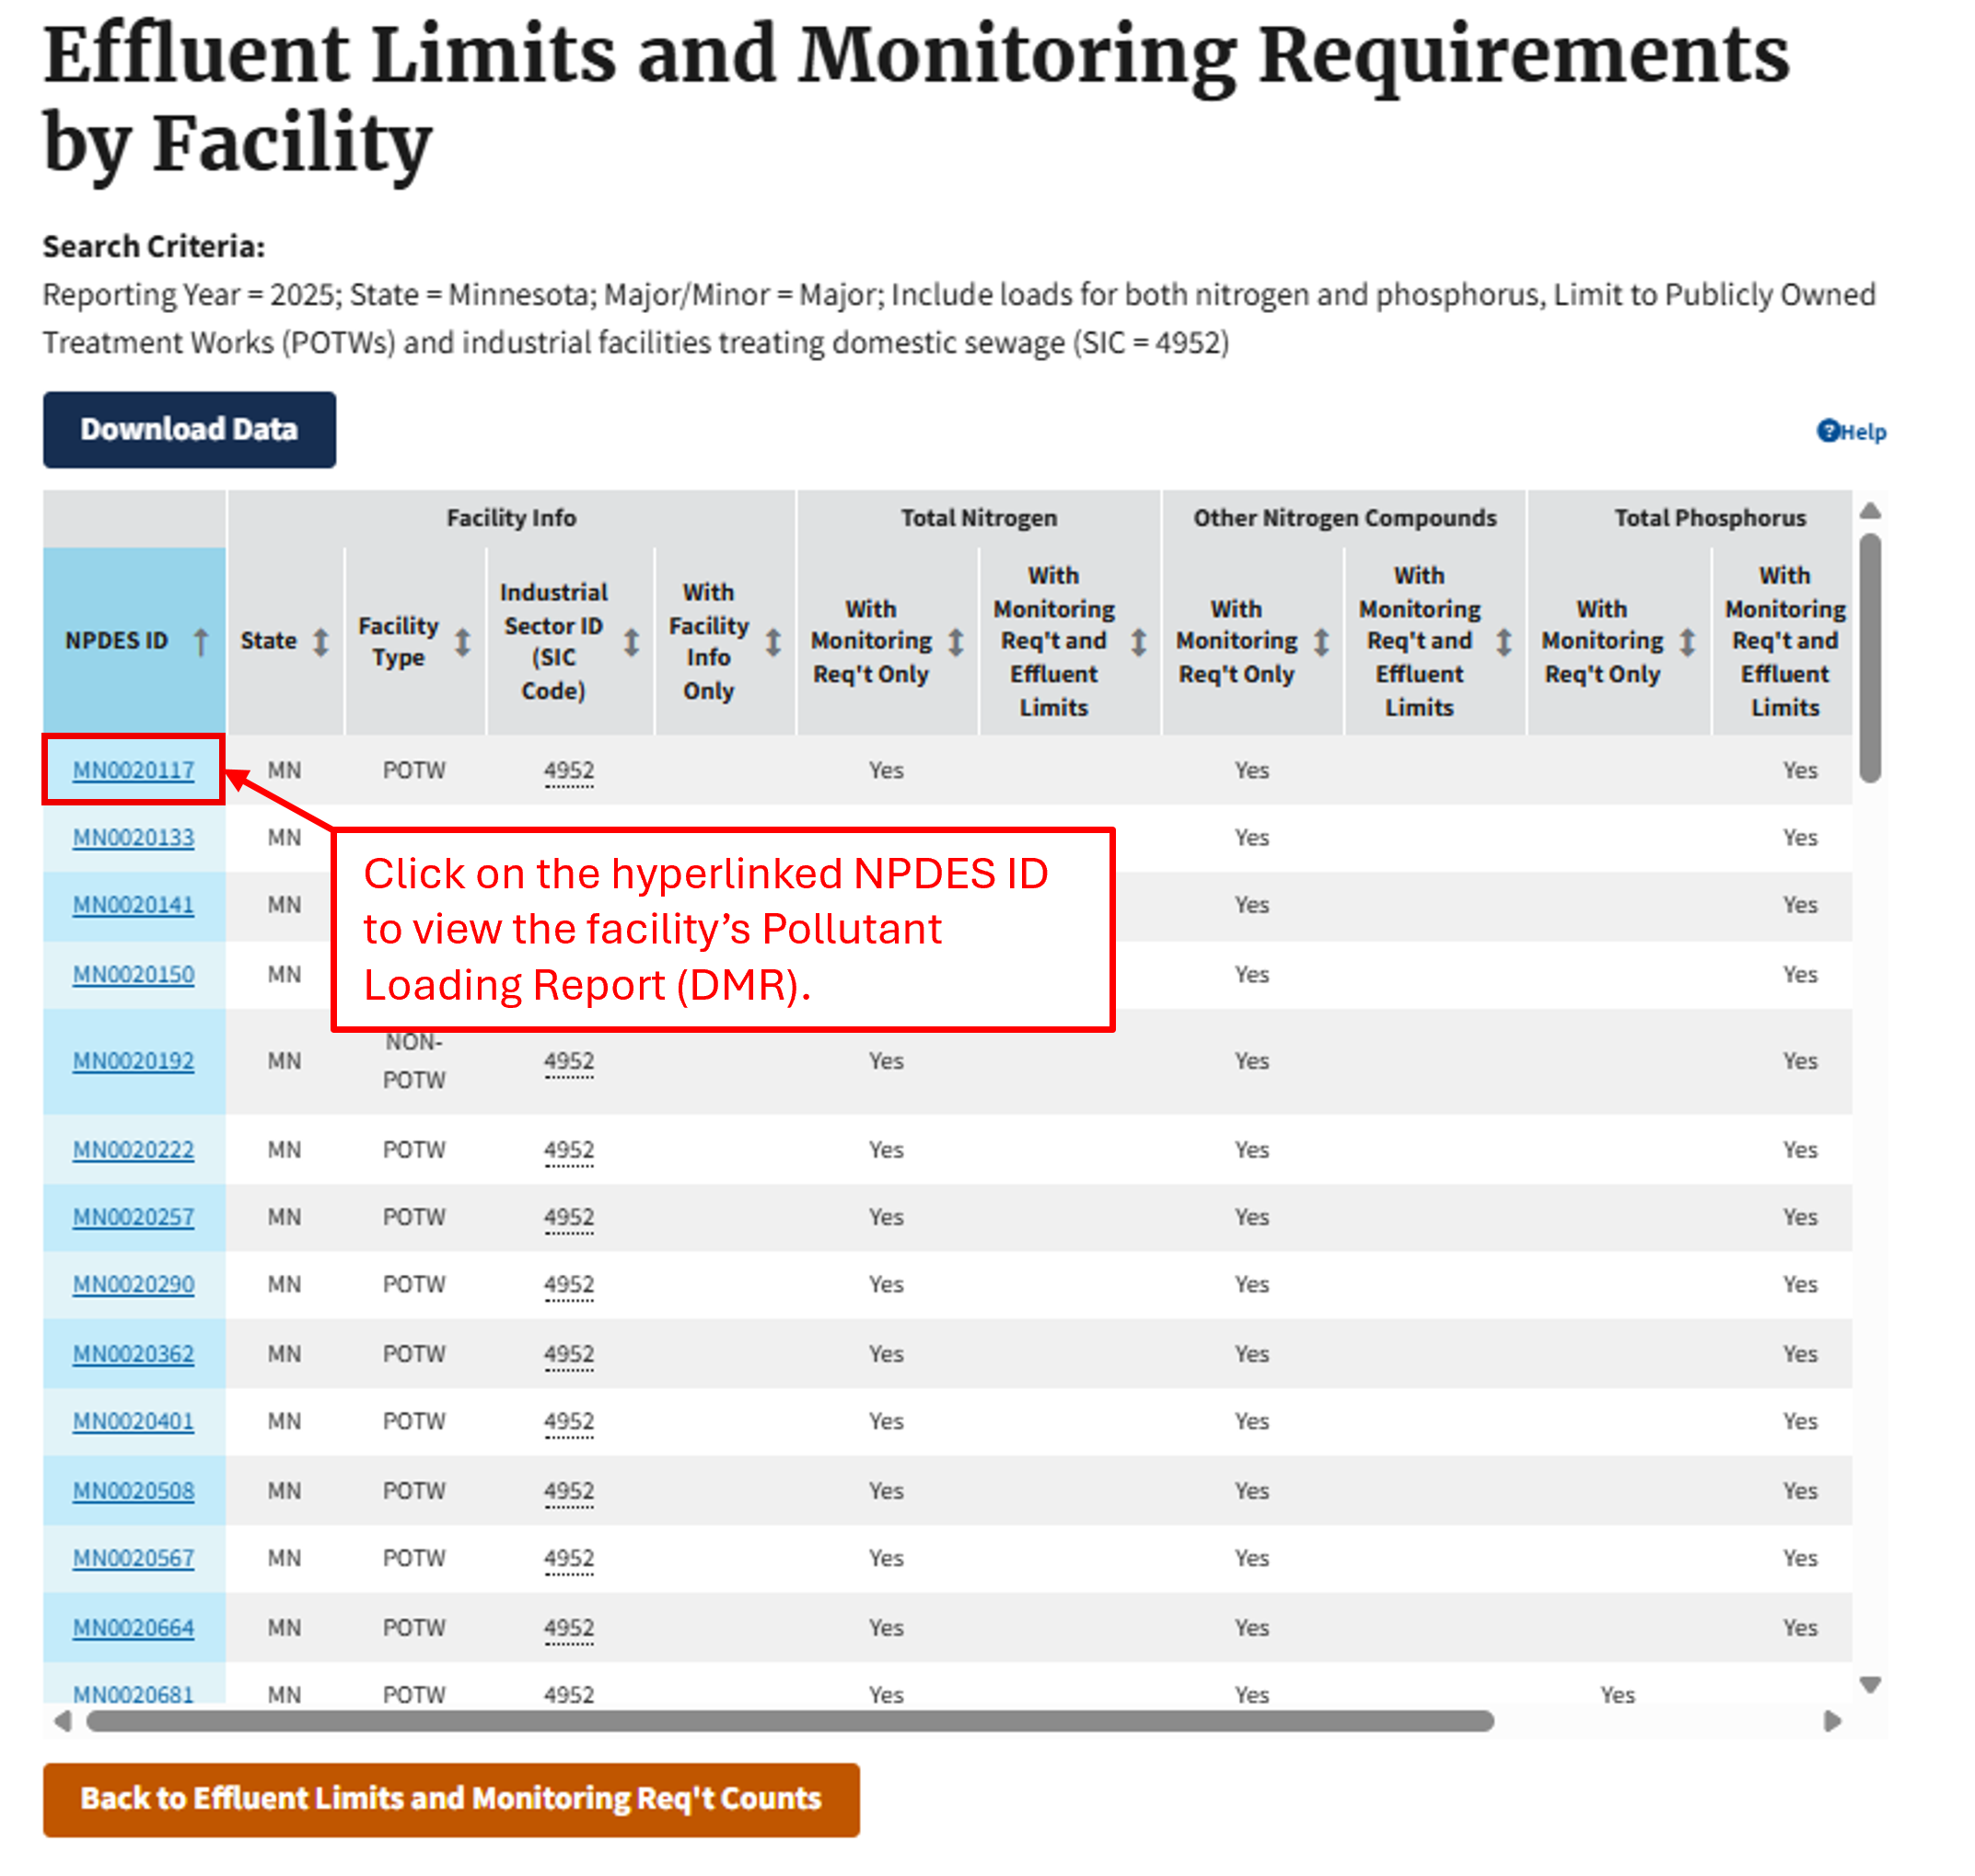
Option 2: "Effluent Limits and Monitoring Requirement Counts"
Users can also generate counts of facilities with monitoring requirements and effluent limits by pressing the "View Effluent Limits and Monitoring Req't Counts" button. For example, the following table shows the counts of all major facilities treating domestic sewage (SIC= 4952) with nitrogen or phosphorus parameters in their NPDES permits in 2025. The hyperlinked state name allows users to drill down to facility-level data, where the hyperlinked NPDES ID provides access to each facility's Pollutant Loading Report (DMR).
Note: The Loading Tool logic for counts of NPDES permits with "monitoring requirements only" is looking at whether limit values are populated. E.g., if the LIMIT_VALUE_NMBR is null for all VALUE_TYPE_CODES (C1, C2, C3, Q1, and Q2) for "Nitrogen, Total as N", then we identify it as having "monitoring requirements only". If one or more of the VALUE_TYPE_CODES has a numeric value (including equal to zero), then we identify it as having "monitoring requirements and effluent limits". The logic does not currently factor in the OPTIONAL_MONITORING_FLAG.
Hypoxia Task Force Scope and Methodology
The HTF Search applies the following criteria to select data for nutrient loadings and to count facilities with effluent limits and monitoring requirements, based on methodology developed for EPA Office of Wastewater Management. Where available, the ICIS-NPDES database fields and codes are provided.
Permit Types
The search includes only Individual NPDES permits (permit_type_code = NPD). The search further excludes any individual NPDES permits that have a non-numeric 3rd character (e.g., CAF001507).
| Element | HTF Counts Methodology |
|---|---|
| NPDES Individual Permits | ✔* |
| NPDES Master General Permits | |
| General Permit Covered Facilities |
*The HTF Methodology further excludes any permits that have a non-numeric third character (e.g., ALR000123)
Permit Status
The search includes only permits flagged as Administratively Continued (ADC), Effective (EFF), or Expired (EXP) in the respective reporting year.
| Element | HTF Counts Methodology |
|---|---|
| Active Permits Only: Administratively Continued (ADC), Effective (EFF), or Expired (EXP) in the Respective Reporting Year. | ✔ |
Permit Version
The search uses the most recent permit version effective during the respective reporting year. In the current year, this is permit version 0.
| Element | HTF Counts Methodology |
|---|---|
| Most Recent Permit Version Effective During the Respective Reporting Year | ✔ |
Permitted Features
The search includes only outfalls labeled as external outfalls or summation outfalls (Perm_feature_type = EXO or SUM).
| Element | HTF Counts Methodology |
|---|---|
| External Outfalls (EXO) | ✔ |
| Summation Outfalls (SUM) | ✔ |
Monitoring Locations
The search only includes nutrient measurements at monitoring locations with monitoring location codes equal to 1, 2, SC, EG, Y, A, and B. The search uses a hierarchy to select nutrient measurements at only one of these monitoring locations to best represent the effluent load for each facility. The order in which the tool selects data from monitoring locations for loading calculations is:
| Priority | Monitoring Location | Notes |
|---|---|---|
| 1 | 2 (Effluent Net) | Monitoring location code 2 represent net effluent discharges, which the tool gives top priority for selection for loading calculations. |
| 2 | 1 (Effluent Gross) | Monitoring location code 1 is the most commonly report effluent gross monitoring location. |
| 3 | Y (Effluent Gross) | Monitoring location code Y represents gross effluent measurements and is third in the selection hierarchy because it is less commonly reported than monitoring location 1. |
| 4 | SC (See Comments) | This upstream monitoring location may be used to monitor trace chemicals that are too diluted to measure at the final outfall. |
| 5 | A (After Disinfection) | This upstream monitoring location may be used to monitor trace chemicals that are too diluted to measure at the final outfall. |
| 6 | B (Before Disinfection) | This upstream monitoring location may be used to monitor trace chemicals that are too diluted to measure at the final outfall. |
| 7 | EG (Effluent Gross) | This monitoring location code is intended for reporting the corresponding effluent measurement for an upstream measurement that was reported using SC, A, or B. The tool includes this monitoring location as the last step in the hierarchy as a safe guard to capture any nutrient measurements that were not reported to the above monitoring locations. |
| Element | HTF Counts Methodology |
|---|---|
| Net Effluent (code = 2) | ✔ |
| Gross Effluent (code = 1) | ✔ |
| Before/After Disinfection (codes = A & B) | ✔ |
| See Comments (code = SC) | ✔ |
Limit Value Type
The search excludes permits for which the Limit Value Type is null.
| Element | HTF Counts Methodology |
|---|---|
| Only include records where the Limit Value Type is populated | ✔ |
Units of Measure
The search includes only records with concentration- or mass-based measurements entered into ICIS-NPDES.
| Element | HTF Counts Methodology |
|---|---|
| Only include Mass- or Concentration-Based Units | ✔ |
Parameter Codes
| Parameter Description | HTF Counts Methodology |
|---|---|
| 00600: Nitrogen, total (as N) | ✔ |
| 51425: Nitrogen, Total As N | ✔ |
| 51445: Nitrogen, Total | ✔ |
| 51537: Nitrogen, Net Total | |
| 51084: Nitrogen, total available (water) | ✔ |
| 00602: Nitrogen, Dissolved | ✔ |
| 00601: Nitrogen, total | |
| 00625: Nitrogen, Kjeldahl, total (as N) | ✔ |
| 51449: Nitrogen, Kjeldahl Total | ✔ |
| 51087: Nitrogen, Kjeldahl, total (TKN) (water) | ✔ |
| 82539: Nitrogen, Kjeldahl | ✔ |
| 49579: Nitrogen, total Kjeldahl | ✔ |
| 81639: Nitrogen Kjeldahl, total (TKN) | ✔ |
| 00623: Nitrogen, Kjeldahl, dissolved (as N) | ✔ |
| 0625D: Nitrogen, Kjeldahl, total [as N] [per discharge] | ✔ |
| 51662: Nitrogen, Kjeldahl,Total [TKN], insoluble | ✔ |
| 00605: Nitrogen, organic total (as N) | ✔ |
| 00607: Nitrogen, organic, dissolved (as N) | ✔ |
| 00610: Nitrogen, ammonia total (as N) | |
| 51446: Nitrogen, Ammonia Total | |
| 00609: Ammonia nitrogen, total, (as N) 30 day | |
| 00612: Nitrogen, ammonia, tot unionized (as N) | |
| 0610S: Nitrogen, ammonia total [as N] [per season] | |
| 34726: Nitrogen, ammonia, total (as NH3) | |
| 51085: Nitrogen, ammonia (NH3-N) | |
| 0610D: Nitrogen, ammonia total [as N] [per discharge] | |
| 61574: Ammonia (as N) + unionized ammonia | |
| 00619: Ammonia, unionized | |
| 00608: Nitrogen, ammonia dissolved | |
| 71845: Nitrogen, ammonia total (as NH4) | |
| 82230: Ammonia & ammonium- total | |
| 00640: Nitrogen, inorganic total | ✔ |
| 51450: Nitrite Plus Nitrate Total | ✔ |
| 00631: Nitrite plus nitrate dissolved 1 det. | ✔ |
| 00630: Nitrite plus nitrate total 1 det. (as N) | ✔ |
| 51489: Nitrogen, Total as NO3 + NH3 | ✔ |
| 00620: Nitrogen, nitrate total (as N) | ✔ |
| 82386: Nitrogen, oxidized | ✔ |
| 82385: Nitrogen oxides (as N) | |
| 51448: Nitrogen, Nitrate Total | ✔ |
| 00618: Nitrogen, nitrate dissolved | ✔ |
| 00621: Nitrate nitrogen, dry weight | ✔ |
| 01299: Nitrogen-nitrate in water, [pct] | ✔ |
| 51675: Annual Nitrate Nitrogen Discharged | ✔ |
| 71850: Nitrogen, nitrate total (as NO3) | ✔ |
| 51794: Nitrite + Nitrate total [as N] | |
| 51100: Nitrogen, total, as NO3, (water) | ✔ |
| 49577: Nitrite plus Nitrate, dry weight [as N] | |
| 51086: Nitrogen, nitrate (NO3), (water) | ✔ |
| 00615: Nitrogen, nitrite total (as N) | |
| 51447: Nitrogen, Nitrite Total | ✔ |
| 00613: Nitrite nitrogen, dissolved (as N) | |
| 71855: Nitrogen, nitrite total (as NO2) | |
| 00665: Phosphorus, total (as P) | ✔ |
| 51451: Phosphorus, Total | ✔ |
| 70507: Phosphorous, in total orthophosphate | ✔ |
| 00670: Phosphorous, total organic (as P) | ✔ |
| 00662: Phosphorous, total recoverable | ✔ |
| 00666: Phosphorus, dissolved | ✔ |
| 51663: Phosphorus, insoluble | ✔ |
| 50785: Phosphorus, ortho | ✔ |
| 51699: Phosphorus, Total (Avg Seasonal Load Cap) | ✔ |
| 0665S: Phosphorus, total [as P] [per season] | ✔ |
| 51426: Phosphorus, Total As P | ✔ |
| 51538: Phosphorus, Net Total | |
| 00664: Dock discharge of phosphorus | ✔ |
| 04157: Phosphorus (reactive as P) | ✔ |
| 51764: Phosphorus Adsorption | ✔ |
| 04175: Phosphate, ortho (as P) | ✔ |
| 00671: Phosphate, dissolved/orthophosphate(as P) | ✔ |
| 70506: Phosphate, dissolved color method (as P) | ✔ |
| 00655: Phosphate, poly (as PO4) | ✔ |
| 00653: Phosphate total soluble | ✔ |
| 00650: Phosphate, total (as PO4) | ✔ |
| 00660: Phosphate, ortho (as PO4) | ✔ |
| 71888: Phosphorus, total soluble (as PO4) | ✔ |
| 70505: Phosphate, total, color method (as P) | ✔ |
| 51092: Phosphate, total (P2O5), water | ✔ |
| 51622: Limiting Nutrient (Nitrogen or Phosphorus) | ✔ |
| Modeled Nutrients | ✔ |