Drinking Water Dashboard Help

On this page: 


 Overview

The EPA/State Drinking Water Dashboard provides an overview of the Safe Drinking Water Act (SDWA) public water system (PWS) regulatory activities of EPA and the implementing states, tribes, and territories. The dashboard provides an easy-to-use summary of key activities to answer questions like: which PWS are regulated, how many PWS have been inspected, how many systems have had alleged violations identified and enforcement action taken, and how many systems have returned to compliance. Users should not use the SDWA Dashboard to learn the up-to-the-minute compliance status of particular violations. For that information, contact the implementing authority (EPA, state, tribe, or territory) that regulates your specific PWS, or contact your local PWS directly.


 Data Sources 

The EPA program system, SDWIS-Fed Reporting Services System, is the source of the data in this dashboard. It is the national database of record for compliance and enforcement activities conducted under the Safe Drinking Water Act. It is used by state, implementing tribe, and territory environmental agencies and by EPA.

The current calendar and federal fiscal year's data are updated quarterly, with a three-month lag (e.g., calendar year data are subject to change until the data are added to the database in April of the following year). 

 About the Data

EPA is aware that the completeness and accuracy of state data are variable, and without investigation and program knowledge, data can be misleading or misinterpreted. Often, there is important context around data that must be taken into account to provide an accurate picture. For example, not all activities and violations may be required to be reported to EPA, and current year data may still be in the process of being reported.

 Caveats

Activities and Violations

Data shown in the EPA/State Dashboards are based on data reported to EPA and may not reflect all compliance monitoring/inspections, enforcement or the full extent of noncompliance within a state. State environmental agencies may have more information on activities and noncompliance within their state on their agency websites.

In 2021, ECHO changed the way it counts Public Water Systems with violations. Reports downloaded prior to April 2022 may have different counts for violation and compliance data. The picture below shows a difference in the old and new violation logic. In the old logic, a public water system was counted as having a reported violation until a resolving action was associated with the violation. A resolving action includes actions like a notice that state compliance was achieved. In the new logic, a system is shown as having a violation through the compliance period. More details can be found in the SDWA Violations and Enforcement Actions section of the Detailed Facility Report Data Dictionary.
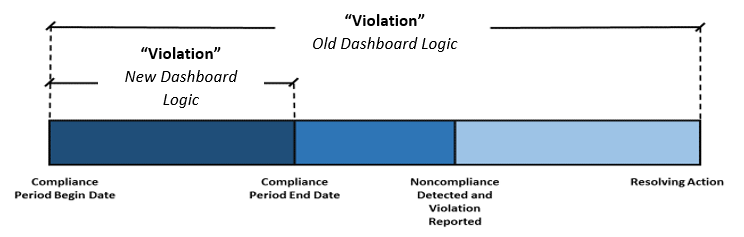
Chart Legends

"State" in chart legends refers to a state, territory, EPA region that directly implements the drinking water program for Indian country, or tribe that EPA has approved for primacy (to date, the Navajo Nation), depending on your menu selection.

Current Year

The most recent federal fiscal year may not show a complete dataset because it has not yet been verified or the year is not completed.

Top of Page


 Using the Dashboard

Filters

The dashboard defaults to show nationwide activity and performance metrics for the most recent ten calendar years. Nine filters are available at the top of the dashboard, which allow users to create many possible customizations of the charts.

Click on any of the filters to see the list of values. Note that after selecting a filter, a search bar will appear that allows users to search for their value of interest. Multiple values may be selected by clicking on multiple selection options. Current selections will be highlighted in green. The charts dynamically update as the user selects value(s) from the dropdown list.

Confirm selection iconFilter selection changes will be saved either by clicking away from the filter dropdown or by clicking the green Confirm Selection button.

Cancel iconIf a user selects or de-selects filter options but does not want to save the changes, they can be canceled by clicking the red Cancel Selection button.

Note that the Cancel Selections button does not clear filter selections. An individual filter can be cleared of all selections by clicking the Clear Selections Clear selections iconbutton to the left in the filter dropdown. There is also a Clear All Selections button at the top left of the dashboard page. 

Additionally, the dashboard charts are interactive; users can click directly on a portion of the chart (e.g., the bars on the chart or items in the chart legend) to change/add filters.

Current filter selections will appear as tabs at the top of the screen, above the page title. Clicking on the "x" button on the filter tab will remove the filter.

Filters available on the dashboard include:

Calendar Year

Filter the dashboard data by Calendar Year.

Fiscal Year

Filter the dashboard data by Federal Fiscal Year. Data for the most recent 10 fiscal years, including the current year, are presented. Data for the current fiscal year in progress are shown as “year-to-date,” while data from previous fiscal years are complete. 

State

Filter the dashboard data by the state the system is located in. "State" refers to a state, territory, EPA region that directly implements the drinking water program for Indian country, or tribe that EPA has approved for primacy (to date, the Navajo Nation).

EPA Region

Filter the dashboard data by EPA Region.

Water System Type

Filter the dashboard data by Public Water System Type.

System Size

Filter the dashboard data by System Size. System size is defined by the population served. System Sizes are:

  • Very Small: 500 or less
  • Small: 501 - 3,300
  • Medium: 3,301 - 10,000
  • Large: 10,001 - 100,000
  • Very Large: Greater than 100,000

Community Type

Filter the dashboard data by community or non-community system types. A community is a public water system that serves at least 15 service connections used by year-round residents or regularly serves at least 25 year-round residents.

Primary Source Water

This filter offers drill-down capabilities. The first time it is selected, it displays broader Primary Source Water Categories. After a category is selected, the filter displays the specific categories by their 2- and 3-letter source codes.

Primary Source Water Type categorizes the primary water source for the public water system. the source of water determines treatment requirements, or other standards. For example, the presences of any surface water sources in a public water system's inventory forces a surface water (SW) classification, even though more groundwater may be supplied than surface water. Any groundwater under the influence of surface water sources in a water system inventory necessitates a Ground Water Under the Influence of Surface Water (GUISW) classification. These higher classifications dictate higher monitoring requirements for the water system and greater public health protection.

  • Surface Water - System has a surface source (e.g., river, reservoir, intake).
  • Ground Water - System has a groundwater source that is not under the direct influence of surface water (e.g., protected wells) and no surface water or groundwater under the influence of surface water sources.
  • Ground Water Under Direct Influence of (UDI) Surface Water - System has a source that provides water under the direct influence of surface water (e.g., unprotected well or springs) and no surface water sources. 
  • Purchased Surface Water - System purchases water that originates from a surface source (e.g., river, reservoir, intake.
  • Purchased Groundwater - System purchases water that originates from groundwater source that is not under the direct influence of surface water (e.g., protected wells) and no surface water or groundwater under the influence of surface water sources.
  • Purchased Groundwater UDI Surface Water - System purchases water that originates from a source that provides water under the direct influence of surface water(e.g., unprotected well or springs)and no surface water sources.

Tribe Name

Filter the dashboard data by a specific tribe name. The association of a facility to a tribe is based on comparing the best available spatial location of the facility to the U.S. Census Bureau’s tribal boundary layer. Some tribal areas may overlap, so a facility may be associated with more than one tribe. This is a geographic distinction and is not based on the permitting agency for the facility. To select all tribe names, use the three dot selection option and choose "Select all" from the dropdown menu.

Top of Page


 Dashboard Chart Types

The following describes the charts available within each of the six sections of this dashboard.

 Public Water Systems

The dashboard delineates the number of active public water systems into three categories.

  • Community water system (CWS) - A PWS that serves at least 15 service connections used by year-round residents or regularly serves at least 25 year-round residents (e.g., homes, apartments and condominiums that are occupied year-round as primary residences).
  • Transient non-community water system (TNCWS) - A non-community PWS that does not regularly serve at least 25 of the same persons over six months per year. A typical example is a campground or a highway rest stop that has its own water source, such as a drinking water well.
  • Non-transient non-community water system (NTNCWS) - A non-community PWS that regularly serves at least 25 of the same persons over six months per year. A typical example of a non-transient non-community water system is a school or an office building that has its own water source, such as a drinking water well.
 PWSs by Type (Single Year %)
Description of Metrics

Definition

Percentages of active Public Water Systems by system type in the selected year.

System Type

Community Water Systems (CWSs), Transient Non-Community Water Systems (TNCWSs), and Non-Transient Non-Community Water Systems (NTNCWSs).

Additional details for the following terms can be found in the Data Dictionary:

Notes: Fiscal year charts and downloads may change when the underlying data in SDWIS are updated. Data presented for calendar year charts will not change as this information source is static and not updated.

 PWSs by Size (Single Year %)
Description of Metrics

Definition

Percentages of active Public Water Systems by system size in the selected year.

System Size

  • Very Small: 500 or less population served
  • Small: 501 - 3,300
  • Medium: 3,301 - 10,000
  • Large: 10,001 - 100,000
  • Very Large: Greater than 100,000

Additional details for the following terms can be found in the Data Dictionary:

Notes: Fiscal year charts and downloads may change when the underlying data in SDWIS are updated. Data presented for calendar year charts will not change as this information source is static and not updated.

Top of Page


 Site Visits

This section displays information about on-site compliance monitoring and assistance activities at public water systems. On-site visits are conducted to evaluate particular aspects of a system's operation and maintenance activities. Along with reviews of any information EPA, tribes, territories, or states require to be submitted, these activities help EPA and its co-regulators ensure that systems comply with environmental laws and regulations.

 PWSs with Any Site Visits
Description of Metrics

Definition

Count of public water systems with one or more site visits during the review period in the selected year.

Site Visit

Includes on-site visits by a regulatory agency staff reviewing system operations and/or compliance with SDWA.

Additional details for the following terms can be found in the Data Dictionary:

Notes: Fiscal year charts and downloads may change when the underlying data in SDWIS are updated. Data presented for calendar year charts will not change as this information source is static and not updated.

 PWSs with Inspections or Sanitary Surveys by Site Visit Type
Description of Metrics

Definition

Count of public water systems with one or more completed sanitary surveys, official inspections, or both during the review period by system type in the selected year.

Sanitary Survey

Every public water system is required to be evaluated by a sanitary survey every three to five years. A sanitary survey is an on-site review of a system's water source, facilities, equipment, operation, and maintenance, intended to point out sanitary deficiencies and assess the system's capability to supply safe drinking water. Systems are evaluated on 11 different aspects of public water system (PWS) operation.

Inspection

Includes official on-site visits by a regulatory agency staff reviewing system operations and/or compliance with SDWA.

Additional details for the following terms can be found in the Data Dictionary:

Notes: Fiscal year charts and downloads may change when the underlying data in SDWIS are updated. Data presented for calendar year charts will not change as this information source is static and not updated.

 PWSs with Inspections or Sanitary Surveys by Community Type
Description of Metrics

Definition

Count of public water systems with one or more completed sanitary surveys, official inspections, or both during the review period by community type in the selected year.

Sanitary Survey

Every public water system is required to be evaluated by a sanitary survey every three to five years. A sanitary survey is an on-site review of a system's water source, facilities, equipment, operation, and maintenance, intended to point out sanitary deficiencies and assess the system's capability to supply safe drinking water. Systems are evaluated on 11 different aspects of public water system (PWS) operation.

Inspection

Includes official on-site visits by a regulatory agency staff reviewing system operations and/or compliance with SDWA.

Additional details for the following terms can be found in the Data Dictionary:

Notes: Fiscal year charts and downloads may change when the underlying data in SDWIS are updated. Data presented for calendar year charts will not change as this information source is static and not updated.

 % PWSs with Any Site Visits
Description of Metrics

Definition

Percentage of public water systems with one or more one or more site visits during the review period in the selected year.

Site Visit

Includes on-site visits by a regulatory agency staff reviewing system operations and/or compliance with SDWA.

State(s) Average (Bar Chart):

PWSs with Site Visits in Selected State(s) / PWSs in Selected State(s)

  • Numerator: The number of public water systems with one or more site visits, including sanitary surveys, during the review period in the selected state(s) in the selected year.
  • Denominator: The number of public water systems in the selected state(s) in the selected year.

National Average (Line Chart):

PWSs with Site Visits / PWSs

  • Numerator: The number of public water systems with one or more site visits, including sanitary surveys, during the review period nationally in the selected year.
  • Denominator: The number of public water systems nationally in the selected year.

Metric Replication


Additional details for the following terms can be found in the Data Dictionary:

Notes

  • The “National Average” line ignores the filters [State] and [EPA Region].
  • Fiscal year charts and downloads may change when the underlying data in SDWIS are updated. Data presented for calendar year charts will not change as this information source is static and not updated.
 Replication of metric for % PWSs with Any Site Visits using Details Table downloads
Source Data for DownloadMetric ComponentNumerator (Count of records where...)Denominator (Count of records where...)
PWSs DetailSelected State(s)"Site Visit Flag" is "Yes" and "State" is {Selected State(s)}"State" is {Selected State(s)}
PWSs DetailNational Average"Site Visit Flag" is "Yes"All records
 % PWSs with Inspections or Sanitary Surveys
Description of Metrics

Definition

Percentage of public water systems with one or more completed sanitary surveys, official inspections, or both during the review period in the selected state(s) compared with the national average in the selected year. 

Sanitary Survey

Every public water system is required to be evaluated by a sanitary survey every three to five years. A sanitary survey is an on-site review of a system's water source, facilities, equipment, operation, and maintenance, intended to point out sanitary deficiencies and assess the system's capability to supply safe drinking water. Systems are evaluated on 11 different aspects of public water system (PWS) operation.

Inspection

Includes official on-site visits by a regulatory agency staff reviewing system operations and/or compliance with SDWA.

State(s) Average (Bar Chart):

PWSs with Inspections or Sanitary Surveys in Selected State(s) / PWSs in Selected State(s)

  • Numerator: The number of public water systems with one or more completed sanitary surveys, official inspections, or both during the review period in the selected state(s) in the selected year.
  • Denominator: The number of public water systems in the selected state(s) in the selected year.

National Average (Line Chart):

PWSs with Inspections or Sanitary Surveys / PWSs

  • Numerator: The number of public water systems with one or more completed sanitary surveys, official inspections, or both during the review period nationally in the selected year.
  • Denominator: The number of public water systems nationally in the selected year.

Metric Replication


Additional details for the following terms can be found in the Data Dictionary:

Notes

  • The “National Average” line ignores the filters [State] and [EPA Region].
  • Fiscal year charts and downloads may change when the underlying data in SDWIS are updated. Data presented for calendar year charts will not change as this information source is static and not updated.
 Replication of metric for % PWSs with Sanitary Surveys using Details Table downloads
Source Data for DownloadMetric ComponentNumerator (Count of records where...)Denominator (Count of records where...)
PWSs DetailSelected State(s)"Sanitary Survey Flag" or "Inspection Flag" is "Yes" and "State" is {Selected State(s)}"State" is {Selected State(s)}
PWSs DetailNational Average"Sanitary Survey Flag" or "Inspection Flag" is "Yes"All records


Top of Page

Violations

This section displays information about percentage of all public water systems with violations of environmental regulations noted.

 PWSs with Any Violation
Description of Metrics

Definition

Count of public water systems with at least one uncorrected violation of any type during the review period in the selected year.

Violation

Documents a breach of a SDWA requirement. Violations may be remedied by compliance/enforcement remedies, such as improved filtration techniques or changes in procedures.

Additional details for the following terms can be found in the Data Dictionary:

Notes: Fiscal year charts and downloads may change when the underlying data in SDWIS are updated. Data presented for calendar year charts will not change as this information source is static and not updated.

 PWSs with Violations by Violation Type
Description of Metrics

Definition

Count of public water systems with at least one uncorrected violation by type during the review period in the selected year.

Violation

Documents a breach of a SDWA requirement. Violations may be remedied by compliance/enforcement remedies, such as improved filtration techniques or changes in procedures.

Additional details for the following terms can be found in the Data Dictionary:

Notes: Fiscal year charts and downloads may change when the underlying data in SDWIS are updated. Data presented for calendar year charts will not change as this information source is static and not updated. A public water system may have uncorrected violations for more than one violation type in a given year. Therefore, counts of PWSs with violations are not mutually exclusive to one type, or bar, in this chart.

 PWSs with Acute Health-Based Violations
Description of Metrics

Definition

Count of public water systems with acute health-based violations in the selected year.

Acute Health-Based Violations

Health-based violations that have the potential to produce immediate illness.

Additional details for the following terms can be found in the Data Dictionary:

Notes: Fiscal year charts and downloads may change when the underlying data in SDWIS are updated. Data presented for calendar year charts will not change as this information source is static and not updated.

 % PWSs with Violations
Description of Metrics

Definition

Percentage of public water systems with at least one uncorrected violation of any type during the review period in the selected state(s) compared with the national average in the selected year.

Violation

Documents a breach of a SDWA requirement. Violations may be remedied by compliance/enforcement remedies, such as improved filtration techniques or changes in procedures.

State(s) Average (Bar Chart):

PWSs with Violations in Selected State(s) / PWSs in Selected State(s)

  • Numerator: The number of public water systems with at least one uncorrected violation of any type during the review period in the selected state(s) in the selected year.
  • Denominator: The number of public water systems in the selected state(s) in the selected year.

National Average (Line Chart):

PWSs with Violations / PWSs

  • Numerator: The number of public water systems with at least one uncorrected violation of any type during the review period nationally in the selected year.
  • Denominator: The number of public water systems nationally in the selected year.

Metric Replication


Additional details for the following terms can be found in the Data Dictionary:

Notes

  • The “National Average” line ignores the filters [State] and [EPA Region].
  • Fiscal year charts and downloads may change when the underlying data in SDWIS are updated. Data presented for calendar year charts will not change as this information source is static and not updated.
 Replication of metric for % PWSs with Violations using Details Table downloads
Source Data for DownloadMetric ComponentNumerator (Count of records where...)Denominator (Count of records where...)
PWSs DetailSelected State(s)"Violation Flag" is "Yes" and "State" is {Selected State(s)}"State" is {Selected State(s)}
PWSs DetailNational Average"Violation Flag" is "Yes"All records
 % PWSs with Acute Health-Based Violations
Description of Metrics

Definition

Percentage of public water systems with acute health-based violations in the selected state(s) compared with the national average in the selected year.

Acute Health-Based Violations

Health-based violations that have the potential to produce immediate illness.

State(s) Average (Bar Chart):

PWSs with Acute Health-Based Violations in Selected State(s) / PWSs in Selected State(s)

  • Numerator: The number of public water systems with acute health-based violations in the selected state(s) in the selected year.
  • Denominator: The number of public water systems in the selected state(s) in the selected year.

National Average (Line Chart):

PWSs with Acute Health-Based Violations / PWSs

  • Numerator: The number of public water systems with acute health-based violations nationally in the selected year.
  • Denominator: The number of public water systems nationally in the selected year.

Metric Replication


Additional details for the following terms can be found in the Data Dictionary:

Notes

  • The “National Average” line ignores the filters [State] and [EPA Region].
  • Fiscal year charts and downloads may change when the underlying data in SDWIS are updated. Data presented for calendar year charts will not change as this information source is static and not updated.
 Replication of metric for % PWSs with Acute Health-Based Violations using Details Table downloads
Source Data for DownloadMetric ComponentNumerator (Count of records where...)Denominator (Count of records where...)
PWSs DetailSelected State(s)"Acute Health-Based Violation Flag" is "Yes" and "State" is {Selected State(s)}"State" is {Selected State(s)}
PWSs DetailNational Average"Acute Health-Based Violation Flag" is "Yes"All records
 % PWSs with Health-Based Violations
Description of Metrics

Definition

Percentage of public water systems with health-based violations in the selected state(s) compared with the national average in the selected year.

Health-Based Violations

Violations of maximum contaminant levels (MCLs) or maximum residual disinfectant levels (MRDLs), which specify the highest concentrations of contaminants or disinfectants, respectively, allowed in drinking water; or of treatment technique (TT) rules, which specify required processes intended to reduce the amounts of contaminants in drinking water.

State(s) Average (Bar Chart):

PWSs with Health-Based Violations in Selected State(s) / PWSs in Selected State(s)

  • Numerator: The number of public water systems with health-based violations in the selected state(s) in the selected year.
  • Denominator: The number of public water systems in the selected state(s) in the selected year.

National Average (Line Chart):

PWSs with Health-Based Violations / PWSs

  • Numerator: The number of public water systems with health-based violations nationally in the selected year.
  • Denominator: The number of public water systems nationally in the selected year.

Metric Replication


Additional details for the following terms can be found in the Data Dictionary:

Notes

  • The “National Average” line ignores the filters [State] and [EPA Region].
  • Fiscal year charts and downloads may change when the underlying data in SDWIS are updated. Data presented for calendar year charts will not change as this information source is static and not updated.
 Replication of metric for % PWSs with Health-Based Violations using Details Table downloads
Source Data for DownloadMetric ComponentNumerator (Count of records where...)Denominator (Count of records where...)
PWSs DetailSelected State(s)"Health-Based Violation Flag" is "Yes" and "State" is {Selected State(s)}"State" is {Selected State(s)}
PWSs DetailNational Average"Health-Based Violation Flag" is "Yes"All records
 % PWSs with Monitoring & Reporting Violations
Description of Metrics

Definition

Percentage of public water systems with monitoring and reporting violations in the selected state(s) compared with the national average in the selected year.

Monitoring and Reporting (MR) Violations

Failure to conduct regular monitoring of drinking water quality, as required by SDWA, or to submit monitoring results in a timely fashion to the state environmental agency or EPA.

State(s) Average (Bar Chart):

PWSs with Monitoring and Reporting Violations in Selected State(s) / PWSs in Selected State(s)

  • Numerator: The number of public water systems with monitoring and reporting violations in the selected state(s) in the selected year.
  • Denominator: The number of public water systems in the selected state(s) in the selected year.

National Average (Line Chart):

PWSs with Monitoring and Reporting Violations / PWSs

  • Numerator: The number of public water systems with monitoring and reporting violations nationally in the selected year.
  • Denominator: The number of public water systems nationally in the selected year.

Metric Replication


Additional details for the following terms can be found in the Data Dictionary:

Notes

  • The “National Average” line ignores the filters [State] and [EPA Region].
  • Fiscal year charts and downloads may change when the underlying data in SDWIS are updated. Data presented for calendar year charts will not change as this information source is static and not updated.
 Replication of metric for % PWSs with Monitoring & Reporting Violations using Details Table downloads
Source Data for DownloadMetric ComponentNumerator (Count of records where...)Denominator (Count of records where...)
PWSs DetailSelected State(s)"Monitoring & Reporting Violation Flag" is "Yes" and "State" is {Selected State(s)}"State" is {Selected State(s)}
PWSs DetailNational Average"Monitoring & Reporting Violation Flag" is "Yes"All records
 % PWSs with Public Notification & Other Violations
Description of Metrics

Definition

Percentage of public water systems with public notification and other violations in the selected state(s) compared with the national average in the selected year.

Public Notice (PN) Violations

Violations of the SDWA public notification requirements to immediately alert consumers if there is a serious problem with their drinking water that may pose a risk to public health.

Other Violations

Violations of other requirements of SDWA, such as issuing annual consumer confidence reports, or conducting periodic sanitary surveys.

State(s) Average (Bar Chart):

PWSs with Public Notification and Other Violations in Selected State(s) / PWSs in Selected State(s)

  • Numerator: The number of public water systems with public notification and other violations in the selected state(s) in the selected year.
  • Denominator: The number of public water systems in the selected state(s) in the selected year.

National Average (Line Chart):

PWSs with Public Notification and Other Violations / PWSs

  • Numerator: The number of public water systems with public notification and other violations nationally in the selected year.
  • Denominator: The number of public water systems nationally in the selected year.

Metric Replication


Additional details for the following terms can be found in the Data Dictionary:

Notes

  • The “National Average” line ignores the filters [State] and [EPA Region].
  • Fiscal year charts and downloads may change when the underlying data in SDWIS are updated. Data presented for calendar year charts will not change as this information source is static and not updated.
 Replication of metric for % PWSs with Public Notification & Other Violations using Details Table downloads
Source Data for DownloadMetric ComponentNumerator (Count of records where...)Denominator (Count of records where...)
PWSs DetailSelected State(s)"Public Notification and Other Violation Flag" is "Yes" and "State" is {Selected State(s)}"State" is {Selected State(s)}
PWSs DetailNational Average"Public Notification and Other Violation Flag" is "Yes"All records

Top of Page


Enforcement Priority

This section displays information about EPA, tribal, territorial, and state enforcement activity at public water systems.

 Priority Systems
Description of Metrics

Definition

Count of public water systems on the enforcement priority list for at least one quarter of the year in the selected year.

Enforcement Priority

A public water system with unresolved serious, multiple, and/or continuing violations.

Additional details for the following terms can be found in the Data Dictionary:

Notes: Fiscal year charts and downloads may change when the underlying data in SDWIS are updated. Data presented for calendar year charts will not change as this information source is static and not updated.

 % PWSs Identified as Priority Systems
Description of Metrics

Definition

Percentage of public water systems on the enforcement priority list for at least one quarter of the year in the selected state(s) compared with the national average in the selected year.

Enforcement Priority

A public water system with unresolved serious, multiple, and/or continuing violations.

State(s) Average (Bar Chart):

PWSs on Enforcement Priority List in Selected State(s) / PWSs in Selected State(s)

  • Numerator: The number of public water systems on the enforcement priority list in the selected state(s) in the selected year.
  • Denominator: The number of public water systems in the selected state(s) in the selected year.

National Average (Line Chart):

PWSs on Enforcement Priority List / PWSs

  • Numerator: The number of public water systems on the enforcement priority list nationally in the selected year.
  • Denominator: The number of public water systems nationally in the selected year.

Metric Replication


Additional details for the following terms can be found in the Data Dictionary:

Notes

  • The “National Average” line ignores the filters [State] and [EPA Region].
  • Fiscal year charts and downloads may change when the underlying data in SDWIS are updated. Data presented for calendar year charts will not change as this information source is static and not updated.
 Replication of metric for % PWSs Identified as Priority Systems using Details Table downloads
Source Data for DownloadMetric ComponentNumerator (Count of records where...)Denominator (Count of records where...)
PWSs DetailSelected State(s)"Enforcement Priority Flag" is "Yes" and "State" is {Selected State(s)}"State" is {Selected State(s)}
PWSs DetailNational Average"Enforcement Priority Flag" is "Yes"All records

Top of Page


 Enforcement Actions

There are many tools available to EPA enforcement and compliance assurance programs. Some tools are used to notify regulated entities regarding potential violations (e.g., Warning Letter, Notice of Non-Compliance). Others are used to advise regulated entities of an impending enforcement action and invite settlement (e.g., Notice of Violation, Show Cause Letter, Pre-Filing Notice Letter, and Notice of Intent to File an Administrative Complaint). Others are the actual enforcement action (e.g., Administrative Penalty Order, Administrative Compliance Order). 

This section displays information about EPA and state enforcement activity at regulated facilities. 

Informal Action : Typically used to address less serious violations, an informal action must meet all the following criteria: 

  1. Is issued by the regulatory agency in writing (paper or electronic) to the regulated entity, 
  2. Is issued as a result of a “potential finding of violation” or a finding of violation, 
  3. Contains a description of the legal and factual basis for the possible action and states with reasonable specificity the nature of the potential finding of violation or finding of violation, 
  4. Includes: 
    1. A statement that the regulated entity should take whatever action(s) is necessary to correct the potential finding of violation or finding of violation, 
    2. A recommended reasonable timeframe for completing and/or reporting, as appropriate, either any necessary actions to correct the potential finding of violation or finding of violation expressed in specific terms (e.g., within 45 days of receipt of this action or prior to the next permit reporting deadline), or a demonstration by the recipient that there is no such violation; and 
    3. A statement describing the steps the regulatory agency “may” take or “is prepared to” take with respect to the potential finding of violation or finding of violation, 
  5. Is not independently enforceable, 
  6. Is not an action established by law or regulation by which the regulatory agency may itself impose or seek through a court or other tribunal, the imposition of a sanction (e.g., a penalty) or injunctive relief for the identified violation, obtain compliance or abate the endangerment, or resolve liability, and
  7. Includes, for self-disclosures where there is a potential finding of violation, acknowledgment that the discloser has certified that the violation has been corrected (e.g., Acknowledgement Letter).

Formal Action : Typically used to address more serious violations and may be independently enforceable, a formal action must meet all the following criteria: 

  1. Is issued by the regulatory agency in writing (paper or electronic) to the regulated entity,
  2. Is issued as a result of a “finding of violation”, a “finding of endangerment”, or a self-disclosure, 
  3. Contains a description of the legal and factual basis for the action and states with reasonable specificity the nature of the finding of violation, 
  4. Is an action established by law or regulation by which the regulatory agency may itself impose or seek through a court or other tribunal, the imposition of a sanction (e.g., a penalty) or injunctive relief for the identified finding of violation, obtain compliance or abate the endangerment, or use to resolve liability (e.g., FIFRA Notices of Warning, Federal Facility Compliance Agreement), and 
  5. For self-disclosures where there is a finding of violation, includes notice that the discloser has certified that the violation has been corrected (e.g., electronic Notice of Determination).
 PWSs with Enforcement Actions
Description of Metrics

Definition

Count of public water systems that received one or more enforcement actions during the review year, by enforcement action type, in the selected year.

Enforcement Action

An action taken to bring a noncompliant public water system back into compliance, with an enforceable consequence if the schedule is not met. 

Additional details for the following terms can be found in the Data Dictionary:

Notes: Fiscal year charts and downloads may change when the underlying data in SDWIS are updated. Data presented for calendar year charts will not change as this information source is static and not updated.

 % PWSs with Formal Enforcement Actions
Description of Metrics

Definition 

Percentage of public water systems that received one or more formal enforcement actions during the review year in the selected state(s) compared with the national average in the selected year.

Formal Enforcement Action

A formal action taken to bring a noncompliant public water system back into compliance, with an enforceable consequence if the schedule is not met. 

State(s) Average (Bar Chart):

PWSs with Formal Enforcement Actions in Selected State(s) / PWSs in Selected State(s)

  • Numerator: The number of public water systems that received one or more formal enforcement actions during the review year in the selected state(s) in the selected year.
  • Denominator: The number of public water systems in the selected state(s) in the selected year.

National Average (Line Chart):

PWSs with Formal Enforcement Actions / PWSs

  • Numerator: The number of public water systems that received one or more formal enforcement actions during the review year nationally in the selected year.
  • Denominator: The number of public water systems nationally in the selected year.

Metric Replication


Additional details for the following terms can be found in the Data Dictionary:

Notes

  • The “National Average” line ignores the filters [State] and [EPA Region].
  • Fiscal year charts and downloads may change when the underlying data in SDWIS are updated. Data presented for calendar year charts will not change as this information source is static and not updated.
 Replication of metric for % PWSs with Formal Enforcement Actions using Details Table downloads
Source Data for DownloadMetric ComponentNumerator (Count of records where...)Denominator (Count of records where...)
PWSs DetailSelected State(s)"Formal Enforcement Action Flag" is "Yes" and "State" is {Selected State(s)}"State" is {Selected State(s)}
PWSs DetailNational Average"Formal Enforcement Action Flag" is "Yes"All records
 % PWSs with Informal Enforcement Actions
Description of Metrics

Definition

Percentage of public water systems that received one or more informal enforcement actions during the review year in the selected state(s) compared with the national average in the selected year.

Informal Enforcement Action

State(s) Average (Bar Chart):

PWSs with Informal Enforcement Actions in Selected State(s) / PWSs in Selected State(s)

  • Numerator: The number of public water systems that received one or more informal enforcement actions during the review year in the selected state(s) in the selected year.
  • Denominator: The number of public water systems in the selected state(s) in the selected year.

National Average (Line Chart):

PWSs with Informal Enforcement Actions / PWSs

  • Numerator: The number of public water systems that received one or more informal enforcement actions during the review year nationally in the selected year.
  • Denominator: The number of public water systems nationally in the selected year.

Metric Replication


Additional details for the following terms can be found in the Data Dictionary:

Notes

  • The “National Average” line ignores the filters [State] and [EPA Region].
  • Fiscal year charts and downloads may change when the underlying data in SDWIS are updated. Data presented for calendar year charts will not change as this information source is static and not updated.
 Replication of metric for % PWSs with Informal Enforcement Actions using Details Table downloads
Source Data for DownloadMetric ComponentNumerator (Count of records where...)Denominator (Count of records where...)
PWSs DetailSelected State(s)"Informal Enforcement Action Flag" is "Yes" and "State" is {Selected State(s)}"State" is {Selected State(s)}
PWSs DetailNational Average"Informal Enforcement Action Flag" is "Yes"All records

Top of Page


 Compliance

This section displays information about penalties at regulated systems that had alleged violations.

 PWSs by Compliance Status
Description of Metrics

Definition

Count of public water systems by their compliance status in the selected year.

Additional details for the following terms can be found in the Data Dictionary:

Notes: Fiscal year charts and downloads may change when the underlying data in SDWIS are updated. Data presented for calendar year charts will not change as this information source is static and not updated.

 PWSs Returned to Compliance
Description of Metrics

Definition

Count of public water systems returned to compliance in the selected year.

Additional details for the following terms can be found in the Data Dictionary:

Notes: Fiscal year charts and downloads may change when the underlying data in SDWIS are updated. Data presented for calendar year charts will not change as this information source is static and not updated.

 Priority Systems Returned to Compliance
Description of Metrics

Definition

Count of public water systems on the enforcement priority list returned to compliance in the selected year.

Additional details for the following terms can be found in the Data Dictionary:

Notes: Fiscal year charts and downloads may change when the underlying data in SDWIS are updated. Data presented for calendar year charts will not change as this information source is static and not updated.

 % PWSs Returned to Compliance
Description of Metrics

Definition

Count of public water systems returned to compliance in the selected state(s) compared with the national average in the selected year.

State(s) Average (Bar Chart):

PWSs Returned to Compliance in Selected State(s) / PWSs in Selected State(s)

  • Numerator: The number of public water systems returned to compliance in the selected state(s) in the selected year.
  • Denominator: The number of public water systems in the selected state(s) in the selected year.

National Average (Line Chart):

PWSs Returned to Compliance / PWSs

  • Numerator: The number of public water systems returned to compliance nationally in the selected year.
  • Denominator: The number of public water systems nationally in the selected year.

Metric Replication


Additional details for the following terms can be found in the Data Dictionary:

Notes

  • The “National Average” line ignores the filters [State] and [EPA Region].
  • Fiscal year charts and downloads may change when the underlying data in SDWIS are updated. Data presented for calendar year charts will not change as this information source is static and not updated.
 Replication of metric for % PWSs Returned to Compliance using Details Table downloads
Source Data for DownloadMetric ComponentNumerator (Count of records where...)Denominator (Count of records where...)
PWSs DetailSelected State(s)"Returned to Compliance Flag" is "Yes" and "State" is {Selected State(s)}"State" is {Selected State(s)}
PWSs DetailNational Average"Returned to Compliance Flag" is "Yes"All records
 % Priority Systems Returned to Compliance
Description of Metrics

Definition

Count of public water systems on the enforcement priority list returned to compliance in the selected state(s) compared with the national average in the selected year.

Enforcement Priority

Count of public water systems on the enforcement priority list returned to compliance in the selected state(s) compared with the national average in the selected year.

State(s) Average (Bar Chart):

PWSs on Enforcement Priority List Returned to Compliance in Selected State(s) / PWSs in Selected State(s)

  • Numerator: The number of public water systems on the enforcement priority list returned to compliance in the selected state(s) in the selected year.
  • Denominator: The number of public water systems in the selected state(s) in the selected year.

National Average (Line Chart):

PWSs on Enforcement Priority List Returned to Compliance / PWSs

  • Numerator: The number of public water systems on the enforcement priority list returned to compliance nationally in the selected year.
  • Denominator: The number of public water systems nationally in the selected year.

Metric Replication


Additional details for the following terms can be found in the Data Dictionary:

Notes

  • The “National Average” line ignores the filters [State] and [EPA Region].
  • Fiscal year charts and downloads may change when the underlying data in SDWIS are updated. Data presented for calendar year charts will not change as this information source is static and not updated.
 Replication of metric for % Priority Systems Returned to Compliance using Details Table downloads
Source Data for DownloadMetric ComponentNumerator (Count of records where...)Denominator (Count of records where...)
PWSs DetailSelected State(s)"Enforcement Priority RTC Flag" is "Yes" and "State" is {Selected State(s)}"State" is {Selected State(s)}
PWSs DetailNational Average"Enforcement Priority RTC Flag" is "Yes"All records

 Data Dictionary

Active 

A system is active if it produces drinking water on a regular basis. A seasonal water system may also be considered active if it is expected to resume operation within the year. Active refers to an operating status of operating, temporarily closed, or seasonal.

Calendar Year 

Runs from January 1 to December 31.

Compliance Status 

Each PWS must comply with a number operating, reporting, and public notification requirements established under the SDWA. The dashboard presents PWS-level data and summary statistics regarding compliance status:

  • No Violation - The PWS is meeting all of its obligations for delivering water that meets EPA health-based standards, required monitoring and reporting, as well as other operating and public notification requirements. Thus, no violation has been identified. 
  • Violation(s) - The PWS not meeting one or more of its obligations for delivering water that meets EPA health-based standards, required monitoring and reporting, as well as other operating and public notification requirements. Thus one or multiple violations were identified. 
  • Enforcement Priority - EPA tracks all violations and assigns either one, five, or ten points to each violation as a reflection of the violation's severity. PWS called "enforcement priority" are an aggregate score of at least eleven points as a result of some combination of: unresolved more serious violations (such as MCL violations related to acute contaminants), multiple violations (health-based, monitoring and reporting, public notification and/or other violations), and/or continuing violations. For these purposes, "continuing" means the violation not been reported either as corrected or as addressed by a formal enforcement action.

Examples of the types of violations that may occur include:

  • Health-Based - These violations fall into three categories: 1) exceedances of the maximum contaminant levels (MCLs) which specify the highest allowable contaminant concentrations in drinking water, 2) exceedances of the maximum residual disinfectant levels (MRDLs), which specify the highest concentrations of disinfectants allowed in drinking water, and 3) treatment technique requirements, which specify certain processes intended to reduce the level of a contaminant.
  • Monitoring and Reporting - Failure to conduct regular monitoring of drinking water quality, or to submit monitoring results in a timely fashion to the state primacy agency or EPA, as required by SDWA.
  • Public Notice - Violations of the public notification requirements, which require systems to alert consumers if there is a serious problem with their drinking water or if there have been other violations of system requirements, as required by SDWA.
  • Other - Violations of other requirements of SDWA, such as failing to issue annual consumer confidence reports.

Enforcement Actions 

There are many tools available to EPA enforcement and compliance assurance programs. Some tools are used to notify regulated entities regarding potential violations (e.g., Warning Letter, Notice of Non-Compliance). Others are used to advise regulated entities of an impending enforcement action and invite settlement (e.g., Notice of Violation, Show Cause Letter, Pre-Filing Notice Letter, and Notice of Intent to File an Administrative Complaint). Others are the actual enforcement action (e.g., Administrative Penalty Order, Administrative Compliance Order). 

The full formal and informal enforcement action   definitions are provided in the Detailed Facility Report Data Dictionary.

Enforcement Priority 

A public water system with unresolved serious, multiple, and/or continuing violations, as identified by the quarterly application of the formula defined below. If the formula outputs a point score that is greater than or equal to 11, then the PWS is considered an enforcement priority.

  • (∑Si) + n where: 
  • S = violation severity factor
    • S = 10 for each acute health-based violation
    • S = 5 for each other health-based violation and Total Coliform Rule (TCR) repeat monitoring violation
    • S = 5 for each Nitrate monitoring and reporting violation
    • S = 1 for each other monitoring and reporting, or any other violation
  • n = number of years that the system's oldest violations have been unaddressed (0 to 5)

Federal Fiscal Year 

The Federal Fiscal Year runs from October 1 to September 30 of the following year. Because the federal fiscal year differ from the fiscal years of individual states, users should take care when comparing results from the EPA/State Dashboards with state-specific summaries of similar compliance and enforcement information.

Inactive

Not active. This includes systems that have gone out of business or have been merged into other drinking water systems.

Public Water System 

A system for the provision to the public of piped water for human consumption, which has at least 15 service connections or regularly serves an average of at least 25 individuals at least 60 days out of the year.

Returned to Compliance

The public water system has completed monitoring, reporting or implementation of treatment or other activities to be in compliance with the regulations.

Sanitary Survey 

An on-site review conducted and reported for each non-community water system every five years, and each community water system every three years. A sanitary survey evaluates eight areas for compliance: water sources; treatment; distribution systems; finished water storage; pumps, pump systems and controls; monitoring, reporting and data verification; water system management and operations; and operator compliance with relevant requirements. A full survey of all eight elements may require multiple visits to a water system.

Site Visit 

Any of the following:

  • Investigation (Complaint/Violation/etc.) - SDWA Official Inspection
  • Site Inspection - SDWA Official Inspection
  • Capacity Development Assessment
  • Compliance Assistance
  • Construction Inspection
  • Comprehensive Performance Evaluation (CPE)
  • Cross Connection Inspection/Investigation
  • Emergency Assistance
  • Engineering Determination/Advice/Plan Review
  • Formal Enforcement
  • Follow-up to Formal Enforcement
  • Informal Enforcement
  • Informal System Inspection
  • Laboratory Certification
  • Laboratory Inspection
  • Locational Data Collection
  • Needs Survey
  • Operation and Maintenance
  • Other
  • Permit (Qualification/Review/Compliance)
  • Public Hearing
  • Record Review
  • Regularly Scheduled
  • Sanitary Hazards Investigation
  • Sample Collection
  • Sanitary Survey, Partial
  • Sanitary Survey, Complete
  • Source Water Inspection
  • State Revolving Fund
  • Sanitary Survey Follow-up
  • Technical Assistance (Non-specific)
  • Training
  • Water Treatment Plant Site Visit
  • Variance/Exemption related
  • Wellhead Protection Program
  • Watershed Evaluation 

System Size

System size is defined by the population served:

  • Very Small: 500 or less
  • Small: 501 - 3,300
  • Medium: 3,301 - 10,000
  • Large: 10,001 - 100,000
  • Very Large: Greater than 100,000

System Type 

  • Community Water Systems (CWSs): A public water system that serves at least 15 service connections used by year-round residents or regularly serves at least 25 year-round residents (e.g., homes, apartments and condominiums that are occupied year-round as primary residences).
  • Non-community water system (NCWS): A public water system that is not a community water system.
    • Transient Non-Community Water Systems (TNCWSs): A public water system that provides water in a place such as a gas station or campground where people do not remain for a long period of time. Specifically, a non-community water system that does not serve 25 of the same nonresident persons per day for more than six months per year. A typical example is a campground or a highway rest stop that has its own water source, such as a drinking water well.
    • Non-Transient Non-Community Water Systems (NTNCWSs): A public water system that regularly supplies water to at least 25 of the same people at least six months per year, but not year-round. Specifically, a non-community water system that regularly serves at least 25 of the same nonresident persons per day for more than six months per year. Some examples are schools, factories, office buildings, and hospitals which have their own water systems.

Violation 

Documents a breach of a SDWA requirement. Violations are detected by assessment of sample results or reviews (including site visits). Violations may lead to legal actions or compliance orders. Violations are publicized, when required, by public notification. Violations may be remedied by compliance/enforcement remedies, such as improved filtration techniques or changes in procedures. SDWA violations fall into one of the following general categories:

  • Health-based violations - Violations of maximum contaminant levels (MCLs) or maximum residual disinfectant levels (MRDLs), which specify the highest concentrations of contaminants or disinfectants, respectively, allowed in drinking water; or of treatment technique (TT) rules, which specify required processes intended to reduce the amounts of contaminants in drinking water. MCLs, MRDLs, and treatment technique rules are all health-based drinking water standards.
  • Acute Health-Based violations - Health-based violations that have the potential to produce immediate illness.
  • Monitoring and reporting (MR) violations - Failure to conduct regular monitoring of drinking water quality, as required by SDWA, or to submit monitoring results in a timely fashion to the state environmental agency or EPA.
  • Public notice (PN) violations - Violations of the public notification requirements of SDWA, which require systems to immediately alert consumers if there is a serious problem with their drinking water that may pose a risk to public health.
  •  Other violations - Violations of other requirements of SDWA, such as issuing annual consumer confidence reports, or conducting periodic sanitary surveys.

 Common Questions

Where do the data come from?

SDWA requires states to report drinking water information periodically to EPA; this information is maintained in the federal database, SDWIS/Fed. SDWIS stands for the Safe Drinking Water Information System and contains information submitted by public water systems to primacy agencies, and by primacy agencies to EPA, to meet the reporting requirements established by the Safe Drinking Water Act (SDWA) and related regulations and guidance.

What caveats should I know about the data in the EPA/State Drinking Water Dashboard?

Data Completeness: EPA is aware of inaccuracies and underreporting of some violation data to SDWIS. Due to the known incompleteness of the data reported by states and regions, we refer to systems as having reported violations or no reported violations.

Frequency of Data Updates: Reported violations may be between 3 and 6 months old by the time they appear in the dashboard, because they are reported to EPA in the fiscal year quarter following the quarter in which they occur. For example, data about enforcement actions taken by September 30 in a given year will become final in SDWIS on December 31, and become available in the dashboard in January or later.

Sample Values: Sample contaminant values that trigger Maximum Contaminant Level (MCL) or Maximum Residual Disinfectant Level (MRDL) violations are not always available in EPA's database of record (SDWIS/Fed). States collect detailed sampling data from public water systems, and are required to submit a portion of their data to EPA. All violations are required to be reported to EPA, but only a subset of the measured values and units are required to be reported to EPA. To find out more about the available sample data, contact your state drinking water program or local water system.

What is a public water system?

A public water system (PWS) is a system for the provision to the public of water for human consumption through pipes or other constructed conveyances, if such system has at least 15 service connections or regularly serves at least 25 individuals at least 60 days out of the year.

Public water systems can be categorized by type:

  • Community Water System - A PWS that serves at least 15 service connections used by year-round residents or regularly serves at least 25 year-round residents (e.g., homes, apartments and condominiums that are occupied year-round as primary residences).
  • Non-transient Non-community Water System - A non-community PWS that regularly serves at least 25 of the same persons over six months per year. A typical example of a non-transient non-community water system is a school or an office building that has its own water source, such as a drinking water well.
  • Transient Non-community Water System - A non-community PWS that does not regularly serve at least 25 of the same persons over six months per year. A typical example is a campground or a highway rest stop that has its own water source, such as a drinking water well.

Public water systems can also be categorized by size, based on the number of people served by the system:

  • Very Small water systems serve 25-500 people
  • Small water systems serve 501-3,300 people
  • Medium water systems serve 3,301-10,000 people
  • Large water systems serve 10,001-100,000 people
  • Very Large water systems serve 100,001+ people.

What are the various types of SDWA violations shown in the dashboard?

Violations required to be reported under SDWA are grouped into the following categories:

  • Health-Based - These violations fall into three categories: 1) exceedances of the maximum contaminant levels (MCLs), which specify the highest allowable contaminant concentrations in drinking water, 2) exceedances of the maximum residual disinfectant levels (MRDLs), which specify the highest concentrations of disinfectants allowed in drinking water, and 3) treatment technique requirements, which specify certain processes intended to reduce the level of a contaminant. Acute health-based violations are those that may cause illness after a short-term exposure.
  • Monitoring and Reporting - Failure to conduct regular monitoring of drinking water quality, or to submit monitoring results in a timely fashion to the state primacy agency or EPA, as required by SDWA.
  • Other Violations - Violations of variances and exemptions, public notice and Consumer Confidence Rule requirements, and others not referenced above.

What is the state's role in ensuring compliance with SDWA Public Water System Supervision Program requirements?

Eligible states, territories, and tribes develop and implement a Public Water System Supervision (PWSS) program adequate to enforce the requirements of the SDWA and ensure that water systems comply with the National Primary Drinking Water Regulations. EPA works with these primacy agencies to ensure that they carry out key activities essential to SDWA Public Water Systems Supervision program.

Currently, all states and territories except Wyoming and the District of Columbia have primacy for the PWSS program. The Navajo Nation is the only Indian tribe to have sought and received primacy for the PWSS program. EPA has primacy in Wyoming and the District of Columbia, and in Indian country, excluding the Navajo Nation, and retains enforcement authority in primacy states.

Key activities carried out by primacy agencies include:

  • developing and maintaining state drinking water regulations that are at least as protective as EPA’s,
  • developing and maintaining an inventory of public water systems throughout the state,
  • developing and maintaining a database to hold compliance information on public water systems,
  • conducting sanitary surveys of public water systems,
  • reviewing public water system plans and specifications,
  • providing technical assistance to managers and operators of public water systems,
  • carrying out a program to ensure that the public water systems regularly inform their consumers about the quality of the water that they are providing,
  • certifying laboratories that can perform the analysis of drinking water that will be used to determine compliance with the regulations, and
  • carrying out an enforcement program to ensure that the public water systems comply with all of the state's requirements.

Each of these activities is necessary to implement the PWSS program and enforce the drinking water standards. While the primacy agencies provide EPA with information on drinking water systems in the national database and in reports, EPA and the primacy agencies also hold regular discussions on the compliance status of systems.

How do primacy agencies respond to noncompliance?

Generally, a primacy agency's first responses to violations are informal actions such as reminder letters, warning letters, notices of violation, field visits, and telephone calls.

If a violation continues or recurs, the primacy agency must initiate a formal enforcement response that requires the violating public water system to return to compliance on an enforceable schedule. Formal enforcement responses include citations, administrative orders with or without penalties, civil referrals to state attorneys general or to the U.S. Department of Justice, filing criminal charges, and other sanctions.

If there is risk to public health, EPA and the primacy agency can issue emergency orders that require the public water system to take immediate action to protect public health and return the system to compliance.