
TRI and DMR Comparison Dashboard Help
The TRI and DMR Comparison Dashboard provides a comparison of wastewater discharge data reported on Discharge Monitoring Reports (DMRs) under the Clean Water Act (CWA) National Pollutant Discharge Elimination System (NPDES) permit program and water releases reported under the Toxics Release Inventory (TRI) at a national, regional or state level.
The dashboard is organized into three primary sections:
For more information about DMR and TRI data in the Loading Tool, see About the Data. To learn about how DMR and TRI data are linked within the Loading Tool, see Linking DMR and TRI data. For advanced users, Comparing CWA, NPDES, DMR Data and TRI Data (20 pp, 735K) provides an in depth discussion of considerations in comparing the two datasets.
Instructions
The dashboard initially displays nationwide comparisons for the most recent year of data. The pie charts illustrate the facility and chemical universes, while the graphs display the top industries and chemicals released for the selected year and geographic area.
Using the Pie Charts
Click on a pie slice to download the data associated only with that series.
Click on a series label in the legend to toggle the series on or off. Each slice of the pie will dynamically adjust proportionate to the series that are toggled on; however, the value of each series will not change. For documentation of the chart elements and data displayed, see Facility Universe and Chemical Universe.
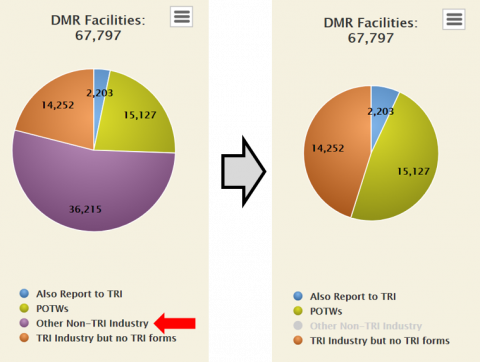
Example of Toggling a Series Off on the DMR Facility Universe Chart
Using the Graphs
Click on a series label in the legend to toggle the series on or off. The horizontal axis of the chart will dynamically adjust proportionate to the values displayed.
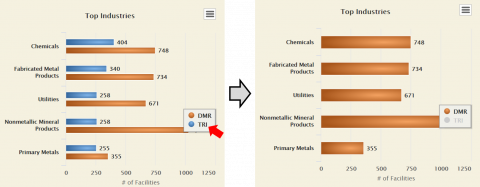
Example Top Industries Graph Example of Toggling a Series Off on the Top Industries Graph
Click on a vertical axis label (i.e., industry or chemical group) to display a comparative drilldown of the top DMR and TRI metrics (i.e., number of facilities, total pounds or total TWPE) for the selected category. Alternatively, click on a bar to display a drill down of only the top metrics for the selected data series and category. Click the Back to Industries/Chemicals button to return to the initial graph.
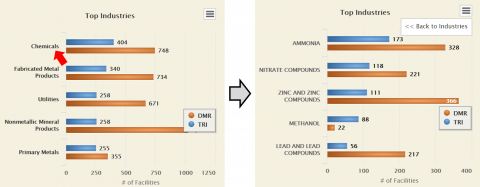
Example Top Industries Drilldown Example of an Industry Drilldown on the Top Industries Graph
For documentation of the chart elements and data displayed, see Top Industries and Top Chemicals Graphs.
Search Criteria
Users may select a reporting year and geographic area (i.e., EPA Region or State) from the dropdown menus. Additional Location or Watershed Search Criteria are also available by expanding the Additional Search Criteria bar. Click Refresh Charts to load the charts based on your selection.
The following search criteria are available:
Reporting Year - The calendar year of the reported pollutant discharges. TRI releases are reported annually, while DMR data are typically reported at more frequent intervals (called monitoring periods) as required in a facility’s NPDES permit (e.g., monthly, quarterly, biannually). The Water Pollutant Loading Tool calculates annual pollutant loadings from permit and DMR data.
EPA Region - The EPA designated area that U.S. states, territories, and tribes are assigned to. There are 10 EPA regions.
State - The states and territories of the United States.
Facility Location
City - The city name for the facility location. Users must select a state to enter a city name. Note that city names can be blank in FRS and ICIS-NPDES. If the city name is not provided for a facility, then searching by city name search will produce no results for that facility.
County - The county name for the facility location. Users must select a state to enter a county name. Note that county names can be blank in FRS and ICIS-NPDES. If the county name is not provided for a facility, then searching by county name will produce no results for that facility.
ZIP Code (5-digit) - The 5-digit mail code for the facility address. Enter a ZIP code to identify facilities located in a specific ZIP code. Not that ZIP codes are not required in FRS or ICIS-NPDES. If a facility's ZIP code is blank, then the ZIP code search will exclude the facility.
Only include facilities that discharge:
- To impaired water bodies: Under section 303(d) of the Clean Water Act, states, territories, and authorized tribes are required to develop lists of impaired waters. Impaired water bodies are waters that are too polluted or otherwise degraded to meet the water quality standards set by states, territories, or authorized tribes. The law requires that these jurisdictions establish priority rankings for waters on the lists and develop TMDLs for these waters. A Total Maximum Daily Load (TMDL) is a calculation of the maximum amount of a pollutant that a water body can receive and still safely meet water quality standards.
- Pollutants contributing to a water body impairment: Limit results to facilities that discharged pollutants that are potentially contributing to the impairment of local water bodies.
- To counties or watersheds with ESA-listed aquatic species: ESA-listed aquatic species are a group of organisms that live in the water for most or all of its life and are designated as threatened or endangered under the Endangered Species Act (ESA). The purpose of the ESA is to protect and recover imperiled species and the ecosystems upon which they depend. It is administered by the U.S. Fish and Wildlife Service and the Commerce Department's National Marine Fisheries Service (NMFS).
Receiving Watershed
Watersheds in ZIP Code - The 5-digit mail code for the facility address to identify facilities in watersheds that overlap with the specified ZIP code's geographic boundaries. For this type of search, the search will produce results if:
- The specified ZIP code overlaps with a Hydrologic Unit Code (HUC) in the Watershed Boundary Database
- The corresponding HUC is connected with a NPDES ID in the Watershed Boundary Dataset; and
- The corresponding NPDES ID is in ICIS-NPDES.
Watershed ID (12-Digit HUC)
Code assigned by the U.S. Geological Survey used to classify watersheds in the United States and the Caribbean. The Loading Tool links facility discharges with hydrologic unit codes (HUC-12) using a WATERS web service. Searching on HUC-12 will produce results if the WATERS web service returns NPDES IDs that correspond to the specified HUC-12. For more information see Overview of Watershed Data.
Major U.S. Watersheds - Search for facilities located within watershed boundaries defined by:
Major Watersheds: the Albemarle and Pamlico Sounds, Chesapeake Bay, Columbia River Basin, Delaware Bay, Delaware River Basin, Great Lakes, Long Island Sound, Lower Columbia River Basin, Mississippi-Atchafalaya River Basin, Mobile Bay, Puget Sound, San Francisco Bay, and Tampa Bay. Many of these watersheds consist of several HUC-12 codes. Maps of these watersheds are available from HUC Maps and Codes for Major U.S. Watersheds.
USGS Watersheds: The U.S. Geological Survey classifies watersheds in the U.S. and Caribbean into 21 regions, represented by a 2-digit Hydrologic Unit Code (HUC).
Large Aquatic Ecosystems (LAEs) Program: EPA's Office of Wetlands, Oceans & Watersheds classifies LAEs to include multiple small watersheds and water resources within a large geographic area that provides significant resources or services, such as food supply, recreation and tourism, groundwater recharge, flood management, air purification, nutrient cycling, and wildlife habitat.
National Estuaries Program (NEP): The NEP identifies nationally significant estuaries of the U.S. for protection and restoration. EPA administers the NEP, but program decisions and activities are carried out by committees of local government officials, private citizens, and representatives from other federal agencies, academic institutions, industry, and estuary user-groups. Estuaries are selected for inclusion in the program through a nomination process. There are currently 28 estuary programs implemented in the U.S.
Summary Table
The summary table provides high level statistics about the facilities, chemicals, and reported pollutant releases from DMR and TRI for a selected year and geographic area.
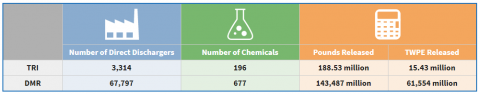
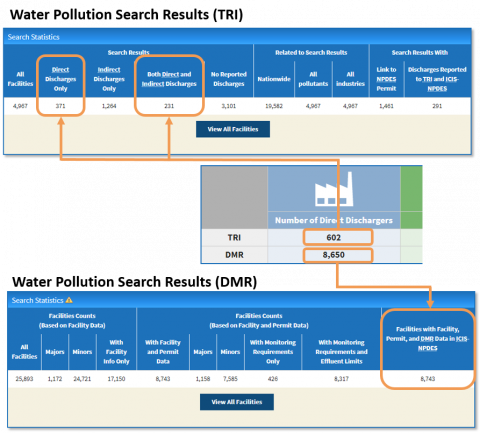
Number of Direct DischargersDischargers are counted by Facility Registry Service (FRS) ID. FRS identifies a facility by assigning an identification number (FRS ID), and uses this FRS ID to link together all regulatory program database records (such as permit IDs and facility IDs that facilities use in reporting to EPA). The DMR data system, ICIS-NPDES, identifies facilities using NPDES permit numbers, while TRI identifies facilities using a unique TRI Facility ID (TRIFID). Both data systems provide the corresponding FRS ID for each NPDES permit and TRIFID. For more information, see Linking DMR and TRI data.
TRI: The number of FRS IDs reporting releases to surface waters of zero or greater pounds under the TRI Program.
DMR: The number of FRS IDs reporting pollutant discharges to surface waters under the NPDES permit program of zero or greater pounds as calculated from EPA’s national NPDES data system (ICIS-NPDES).
Note: FRS IDs may link to one or more NPDES IDs or TRIFIDs. As a result, the counts displayed in the Comparative Dashboard may not match counts in the results of a TRI or DMR Water Pollution Search, as the search statistics for these features count TRIFIDs and NPDES IDs, respectively.
Number of Chemicals
DMRs use parameter codes to identify pollutants. These parameter codes are specific to the chemical identity (chemical abstract service (CAS) number) and analysis type. As a result, multiple parameter codes may exist for a single CAS number (e.g., total residual chlorine, free available chlorine).
In TRI, chemicals are identified, for the most part, using CAS numbers. TRI also includes chemical categories, such as glycol ethers and chlorophenols, which comprise multiple CAS numbers.
To match DMR discharge data to TRI releases, EPA assigns chemicals to a list of unique chemical groups. To learn more about linking DMR and TRI chemicals and download the chemical groupings, see the discussion of the Pollutant Crosswalk in Linking DMR and TRI data.
TRI: The number of distinct chemical groups reported as released. For a list of chemicals covered under the TRI program, see TRI-Listed Chemicals.
DMR: The number of distinct chemical groups reported as discharged. For a complete list of pollutants reported on DMRs, see DMR Pollutant Parameters Used and Not Used by the Loading Tool.
Pounds Released: Total pounds released during the selected reporting year as reported to TRI or in DMRs.
TWPE Released: Toxic Weighted Pounds Equivalent (TWPE) is the mass of a pollutant or chemical discharged that accounts for its relative toxicity. To convert pollutant loadings into TWPE, EPA multiplies the pollutant mass (in pounds) by its toxic weighting factor (TWF).
Note: EPA developed TWFs for use in its Effluent Limitations Guidelines and Standards (ELGs) development program to allow comparison of pollutants with varying toxicities. See Technical Support Documents for more information on TWF values and methodology.
Facility and Chemical Universe Pie Charts
Facility Universe
This chart displays the TRI and DMR facility universes split into several categories for comparison.
Select Metric: The facility universe can be displayed in three ways:
- # Facilities - The number of distinct FRS IDs reporting discharges in the selected reporting year.
- Total Pounds - The total pounds of pollutants discharged in the selected reporting year.
- Total TWPE - The total toxic weighted pounds equivalent of pollutants discharged in the selected reporting year.
The values displayed below the DMR and TRI Facilities chart headings represent the totals for the selected metric.
TRI Facilities: The universe of TRI facilities reporting direct or indirect wastewater discharges (greater than zero) is broken into the following categories during a reporting year:
- Report DMRs: Direct Discharge - Facilities that reported only surface water releases to TRI (i.e., no indirect discharges reported) and also have DMR pollutant loadings (greater than or equal to zero).
- Report DMRs: Direct/Indirect Discharge - Facilities that reported both surface water releases and transfers to POTWs to TRI that also have DMR pollutant loadings (greater than or equal to zero).
- Report DMRs: Indirect Discharge - Facilities that reported transfers to POTWs to TRI that also and also have DMR pollutant loadings (greater than or equal to zero).
- No Linked Active NPDES IDs - Facilities that reported surface water/direct releases (greater than or equal to zero) to TRI and are not linked to an active NPDES ID. See Known Data Problems for data quality considerations related to this category.
Note that these linkages are specific to the selected reporting year. While TRI data are reported once per year, NPDES data may be updated more frequently. For example, the facility may be linked to an active NPDES permit during a different reporting year or a NPDES permit may have been issued following the latest TRI reporting period. - Linked NPDES ID/Not a DMR Filer - Facilities that reported surface water/direct releases (greater than or equal to zero) to TRI and are linked to a NPDES ID that does not have DMR pollutant loadings; however, the NPDES ID is not identified as a DMR filer. Note: If there are no facilities meeting these criteria, this slice of the pie chart will not be visible.
- Linked NPDES ID/DMR Filer - Facilities that reported surface water/direct releases (greater than or equal to zero) to TRI, are linked to a NPDES ID that does not have DMR pollutant loadings, and the linked NPDES ID is identified as a DMR filer. For the purpose of this dashboard, DMR filers are defined as having "NPDES Data Group" = G3A or G3B in ICIS-NPDES, and have an active permit status of Effective (EFF), Administratively Continued (ADC), or Expired (EXP) as of January 1 of the selected calendar year.
- Indirect Dsch No DMRs - Facilities that only reported transfers to POTWs to TRI and did not report DMRs.
Note: TRI reporting is limited to industrial facilities (i.e., POTWs do not report to TRI) that meet certain reporting thresholds. To learn more about the TRI Facility Universe, see About the Data, the Reporting for TRI Facilities, and Factors to Consider When Using TRI Data.
DMR Facilities: The facility universe is broken into four distinct categories:
- Also Report to TRI - Facilities reporting DMRs that also reported direct or indirect releases to TRI greater than or equal to zero in the selected reporting year.
- POTWs - All Publicly Owned Treatment Works (POTWs) reporting DMRs in the selected reporting year. TRI reporting is limited to industrial facilities.
- Other Non-TRI Industry - Industrial facilities reporting DMRs that are not classified in an industry sector that reports to TRI and did not report to TRI. For more information on industry classifications in the Water Pollutant Loading Tool, see Linking DMR and TRI data.
- TRI Industry but no TRI forms - Industrial facilities reporting DMRs that are classified in a specific industry sector that reports to TRI, but did not report to TRI. For more information on industry classifications in the Water Pollutant Loading Tool, see Linking DMR and TRI data.
Note: To learn more about the DMR Facility Universe, see About the Data. A facility must meet three reporting thresholds to be required to report to TRI. For more information on TRI reporting criteria, see the Reporting for TRI Facilities.
Download Facility Lists: Select the buttons below the charts to download comma-separated values (CSV) files of the DMR and TRI facilities either by distinct FRS IDs (Download All Facilities) or distinct NPDES IDs (Download NPDES Details). Select a slice of the pie chart to download only the facilities (by FRS ID) that make up that category. The data included in the downloads are described in the tables below.
| Table Column | Description |
|---|---|
| FRS ID | Facility Registry Service (FRS) identification number. FRS uniquely identifies a facility by assigning an identification number (FRS ID), and uses this FRS ID to link together all regulatory program database records (such as permit IDs and facility IDs that facilities use in reporting to EPA). |
| NPDES IDs | A unique 9-character ID assigned for each permit within the National Pollutant Discharge Elimination System (NPDES) program. The ID may contain both letters and numbers and often begins with the two-letter abbreviation for the state in which the facility is permitted. There may be one or more NPDES ID associated with each FRS ID. |
| TRI Facility ID(s) | A unique 15-character ID assigned for each facility within the Toxics Release Inventory (TRI) program. The format is ZZZZZNNNNNSSSSS, where ZZZZZ = ZIP code, NNNNN = the first 5 consonants of the name, and SSSSS = the first 5 non-blank non-special characters in the street address. There may be one or more TRI IDs associated with each FRS ID. |
| Facility Name | The company or permit holder name as maintained in FRS. |
| City | The city where the facility is located, as maintained in FRS. |
| County | The county where the facility is located, as maintained in FRS. |
| State | The two-character state abbreviation where the facility is located, as maintained in FRS. |
| EPA Region | The EPA Region where the facility is located. EPA has 10 regional offices that execute programs within several states and territories. |
| ZIP Code | The 5- to 9-digit ZIP code where the facility is located. |
| HUC-12 Code | The 12-digit Hydrologic Unit Code (HUC) of the watershed in which the facility resides. |
| Discharges to Impaired Water Bodies | A Yes/No field to indicate whether the facility discharges wastewater to an impaired water body. Impaired water bodies are waters that are too polluted or otherwise degraded to meet the water quality standards set by states, territories, or authorized tribes. |
| Discharges Pollutants Contributing to Water Body Impairment | A Yes/No field to indicate whether the facility discharges pollutants potentially contributing to the receiving water body's impairment. |
| Facility Type Indicator | The facility ownership classification derived from codes in ICIS-NPDES. Facilities can be classified as publicly owned treatment works (POTW), non-POTW, federal, or state. "None" indicates that a facility type was not entered. |
| DMR Industry | The name of the DMR industry sector, based on the 4-digit Standard Industrial Classification (SIC) code. |
| TRI Industry Flag | A Yes/No field to indicate whether the facility is classified within a TRI industry sector. |
| TRI Industry | The name of the TRI Industry sector, based on the 6-digit North American Industry Classification System (NAICS) code. A list of the industry sectors can be found in Linking DMR and TRI data. |
| DMR Pounds | The total pounds of pollutants discharged by the FRS ID. Pollutant discharge amounts are calculated using DMR data from ICIS-NPDES. |
| DMR TWPE | The total toxic weighted pounds equivalent (TWPE) discharged by the FRS ID. |
| Contains Potential Outlier | A Yes/No field to indicate that DMR Pounds contains loads that are calculated using data that has been flagged as potential outliers or data errors. Y = Yes; Blank = No. |
| TRI Direct Release (lb/yr) | The TRI-reported direct chemical releases to surface waters, in pounds, for the FRS ID. |
| TRI Direct TWPE (lb-eq/yr) | The TRI-reported direct chemical releases to surface waters, in toxic weighted pounds equivalent (TWPE), for the FRS ID. |
| TRI Indirect Pounds (lb/yr) | The TRI-reported indirect chemical releases to POTWs in pounds for the FRS ID. |
| TRI Indirect TWPE (lb-eq/yr) | The TRI-reported indirect chemical releases to POTWs in toxic weighted pounds equivalent (TWPE) for the FRS ID. |
| NPDES Permit Status | Lists the status of the NPDES permit. |
| DMR Filers | Lists the NPDES IDs identified as DMR filers. DMR filers are defined as having "NPDES Data Group" = G3A or G3B in ICIS-NPDES, and have an active permit status of Effective (EFF), Administratively Continued (ADC), or Expired (EXP) as of January 1 of the selected calendar year. |
| NPDES with Active Effluent Limits | Lists the NPDES permits with active numeric permit limits for pollutants at effluent discharge points (e.g., outfalls or permitted features) in the selected reporting year. |
| NPDES with DMR Data | Lists the NPDES permits with DMR data in the selected reporting year. |
| NPDES with Pollutant Loadings | Lists the NPDES permits with pollutant loadings greater than or equal to zero in the selected reporting year. |
| Facility Universe Category | Indicates the universe category the facility belongs to. |
| Link to Multi-Yr Report | Unique URL for each FRS ID to access the Facility Multi-Year Loading Report, which compares TRI and DMR loads for the last five years. |
| Table Column | Description |
|---|---|
| FRS ID | Facility Registry Service (FRS) identification number. FRS uniquely identifies a facility by assigning an identification number (FRS ID), and uses this FRS ID to link together all regulatory program database records (such as permit IDs and facility IDs that facilities use in reporting to EPA). Each NPDES links to a FRS ID. More than one NPDES ID may link to the same FRS ID. |
| NPDES ID | A unique 9-character ID assigned for each permit within the National Pollutant Discharge Elimination System (NPDES) program. The ID may contain both letters and numbers and often begins with the two-letter abbreviation for the state in which the facility is permitted. |
| TRI Facility ID(s) | A unique 15-character ID assigned for each facility within the Toxics Release Inventory (TRI) program. The format is ZZZZZNNNNNSSSSS, where ZZZZZ = ZIP code, NNNNN = the first 5 consonants of the name, and SSSSS = the first 5 non-blank non-special characters in the street address. There may be one or more TRI IDs associated with each NPDES ID, based on the linkage with FRS. |
| Facility Name | The company or permit holder name as maintained in FRS. |
| City | The city where the facility is located, as maintained in FRS. |
| County | The county where the facility is located, as maintained in FRS. |
| State | The two-character state abbreviation where the facility is located, as maintained in FRS. |
| EPA Region | The EPA Region where the facility is located. EPA has 10 regional offices that execute programs within several states and territories. |
| ZIP Code | The 5- to 9-digit ZIP code where the facility is located. |
| HUC-12 Code | The 12-digit Hydrologic Unit Code (HUC) of the watershed in which the facility resides. |
| Discharges to Impaired Water Bodies | A Yes/No field to indicate whether the facility discharges wastewater to an impaired water body. Impaired water bodies are waters that are too polluted or otherwise degraded to meet the water quality standards set by states, territories, or authorized tribes. |
| Discharges Pollutants Contributing to Water Body Impairment | A Yes/No field to indicate whether the facility discharges pollutants potentially contributing to the receiving water body's impairment. |
| Facility Type Indicator | The facility ownership classification derived from codes in ICIS-NPDES. Facilities can be classified as publicly owned treatment works (POTW), non-POTW, federal, or state. "None" indicates that a facility type was not entered. |
| Permit Status | Lists the status of the permit. |
| DMR Industry | The name of the DMR industry sector, based on the 4-digit Standard Industrial Classification (SIC) code. |
| TRI Industry Flag | A Yes/No field to indicate whether the facility is classified within a TRI industry sector. |
| TRI Industry | The name of the TRI Industry sector, based on the 6-digit North American Industry Classification System (NAICS) code. A list of the industry sectors can be found in Linking DMR and TRI data. |
| DMR Pounds | The total pounds of pollutants discharged by the FRS ID. Pollutant discharge amounts are calculated using DMR data from ICIS-NPDES. |
| DMR TWPE | The total toxic weighted pounds equivalent (TWPE) discharged by the FRS ID. |
| Contains Potential Outlier | A Yes/No field to indicate that DMR Pounds contains loads that are calculated using data that has been flagged as potential outliers or data errors. Y = Yes; Blank = No. |
| TRI Direct Release (lb/yr) | The TRI-reported direct chemical releases to surface waters in pounds for the FRS ID |
| TRI Direct TWPE (lb-eq/yr) | The TRI-reported direct chemical releases to surface waters in toxic weighted pounds equivalent (TWPE) for the FRS ID |
| TRI Indirect Release (lb/yr) | The TRI-reported indirect chemical releases to POTWs in pounds for the FRS ID |
| TRI Indirect TWPE (lb-eq/yr) | The TRI-reported indirect chemical releases to POTWs in toxic weighted pounds equivalent (TWPE) for the FRS ID |
| DMR Filer | "Y" identifies the NPDES permit as a DMR filer. DMR filers are defined as having "NPDES Data Group" = G3A or G3B in ICIS-NPDES, and have an active permit status of Effective (EFF), Administratively Continued (ADC), or Expired (EXP) as of January 1 of the selected calendar year. |
| NPDES with Active Effluent Limits | "Y" indicates that the NPDES permit has active numeric permit limits for pollutants at effluent discharge points (e.g., outfalls or permitted features) in the selected reporting year. |
| NPDES with DMR Data | "Y" indicates that the NPDES permit has DMR data in the selected reporting year. |
| NPDES with Pollutant Loadings | "Y" indicates that the NPDES permits has pollutant loadings greater than or equal to zero in the selected reporting year. |
| Facility Universe Category | Indicates the universe category the facility belongs to. |
| Link to Multi-Yr Report | Unique URL for each FRS ID to access the Facility Multi-Year Loading Report, which compares TRI and DMR loads for the last five years. |
Chemical Universe
The chemical universe chart compares TRI-reported direct chemical releases to DMR-reported direct surface water discharges.
Select Metric: The chemical universe can be displayed in three ways:
- # Chemicals - The total number of distinct chemical groups
- Total Pounds - The total pounds of pollutants discharged
- Total TWPE - The total toxic weighted pounds equivalent discharged
The values displayed below the DMR and TRI Chemicals chart headings represent the totals for the selected metric.
TRI Chemicals
- Also Reported on DMRs - Chemical groups reported to TRI that were also reported on DMRs
- Only Reported to TRI - Chemical groups only reported to TRI
DMR Chemicals
- Also Reported to TRI - Chemical groups reported on DMRs that were also reported to TRI
- Not on TRI List (Not in TRI) - Chemical groups reported only on DMRs that have an assigned toxic weighting factor (TWF) and are not TRI-listed chemicals
- On TRI List (Not in TRI) - Chemical groups reported only on DMRs that have TWFs and are TRI-listed chemicals
Download Chemical List: Select to download a CSV file of the chemicals, total pounds, and total TWPE included in each chart. The data included are described in the table below.
| Table Column | Description |
|---|---|
| Chemical | The name of the chemical group. For a complete list, see DMR/TRI Chemical Group Crosswalk (XLSX) (102 K) |
| DMR Facility Count | The highest count of FRS IDs reporting DMRs. |
| TRI Facility Count | The highest count of FRS IDs reporting direct discharges to TRI. |
| DMR Pounds | The total pounds of the chemical group discharged. Pollutant discharge amounts are calculated using DMR data from ICIS-NPDES. |
| DMR TWPE | The total toxic weighted pounds equivalent (TWPE) of the chemical group discharged. |
| Contains Potential Outlier | A Yes/No field to indicate that DMR Pounds contains loads that are calculated using data that has been flagged as potential outliers or data errors. Y = Yes; Blank = No. |
| TRI Pounds | The TRI-reported direct chemical releases to surface waters in pounds. |
| TRI TWPE | The TRI-reported direct chemical releases to surface waters in toxic weighted pounds equivalent (TWPE). |
| Has Toxic Weighting | Chemical group has an assigned toxic weighting factor (TWF). Y = Yes; Blank = No. |
| On TRI List | Chemical group is a TRI-listed chemical. Y = Yes; Blank = No. |
Top Industries and Top Chemicals
These charts display the top five industries and chemical groups based on the selected metric.
Select Metric - Users can display the graphs in three ways:
- # Facilities - The number of unique FRS IDs reporting direct discharges to TRI and on DMRs
- Total Pounds - The total pounds of pollutants directly discharged
- Total TWPE - The total toxic weighted pounds equivalent directly discharged
Users may further restrict results by industry or chemical universe.
Select Industry Universe - The complete TRI industry universe is included in all comparisons. Restrict the DMR industry universe to facilities within three categories:
- TRI Industries (DEFAULT) - All industrial facilities classified under TRI industry sectors. For more information on industry classifications in the Water Pollutant Loading Tool, see Linking DMR and TRI data.
- All Non-POTWs - This includes all industries facilities (that may or may not be classified under TRI Industry sectors)
- All Point Sources - No restrictions. All point source discharges, including POTWs and Industrial Dischargers
Select Chemical Universe - The complete TRI chemical universe is included in all comparisons. Restrict the DMR chemical universe to discharges of the following categories:
- TRI Chemicals (DEFAULT) - Only chemical groups that include TRI-listed chemicals
- All Toxic Chemicals - Chemical groups with TWFs (e.g., excludes BOD, TSS etc.). This category includes all chemical groups within the TRI chemicals category as well as other toxic chemicals that are not on the TRI list.
- All Chemicals - No restrictions. All chemical groups are included.
Users may view the top five industries and chemical groups, sorted descending, based the following attributes:
- Facility Count
- TRI (DEFAULT): Highest count of FRS IDs reporting direct discharges to TRI
- DMR: Highest count of FRS IDs reporting DMRs
- Chemical Pounds
- TRI: Largest TRI-reported direct chemical releases in pounds
- DMR: Largest DMR-reported pollutant discharges in pounds
- TWPE
- TRI: Largest TRI-reported direct chemical releases in toxic weighted pounds equivalent
- DMR: Largest DMR-reported pollutant discharges in toxic weighted pounds equivalent
- Pounds Difference
- TRI>DMR: Largest difference in direct chemical releases (in pounds) where TRI releases were greater than DMR discharges
- DMR>TRI: Largest difference in direct chemical releases (in pounds) where DMR discharges were greater than TRI releases
- TWPE Difference
- TRI>DMR: Largest difference in direct chemical releases (in toxic weighted pounds equivalent) where TRI releases were greater than DMR discharges
- DMR>TRI: Largest difference in direct chemical releases (in toxic weighted pounds equivalent) where DMR discharges were greater than TRI releases
- Facility Count
Top Industries
The graph displays the DMR and TRI values for the top five industries based on the selected metric, chemical universe, and facility universe. For the complete list of industries and associated metrics, select Download All Industries to download a CSV file. Select Download All Facilities to download a CSV file of all facilities classified under each industry category. The data included are described in the tables below.
Tip: To dig deeper and view multiple years of data by industry classification, use the Water Pollution Search. On the TRI Search Results page, under the Top NAICS Discharges table, click "Compare to DMR."
| Table Column | Description |
|---|---|
| Industry | The name of the TRI Industry sector, based on the 6-digit North American Industry Classification System (NAICS) code associated with the TRI ID. A list of the industry sectors can be found in Linking DMR and TRI Data. |
| DMR Facility Count | The highest count of FRS IDs reporting DMRs. |
| TRI Facility Count | The highest count of FRS IDs reporting direct discharges to TRI. |
| DMR Pounds | The total pounds of pollutants discharged by the FRS ID. Pollutant discharge amounts are calculated using DMR data from ICIS-NPDES. |
| DMR TWPE | The total toxic weighted pounds equivalent (TWPE) discharged by the FRS ID. |
| TRI Pounds | The TRI-reported direct chemical releases to surface waters in pounds for the FRS ID. |
| TRI TWPE | The TRI-reported direct chemical releases to surface waters in toxic weighted pounds equivalent (TWPE) for the FRS ID. |
| Table Column | Description |
|---|---|
| FRS ID | Facility Registry Service (FRS) identification number. FRS uniquely identifies a facility by assigning an identification number (FRS ID), and uses this FRS ID to link together all regulatory program database records (such as permit IDs and facility IDs that facilities use in reporting to EPA). |
| NPDES IDs | A unique 9-character ID assigned for each permit within the National Pollutant Discharge Elimination System (NPDES) program. The ID may contain both letters and numbers and often begins with the two-letter abbreviation for the state in which the facility is permitted. |
| TRI FIDs | A unique 15-character ID assigned for each facility within the Toxics Release Inventory (TRI) program. The format is ZZZZZNNNNNSSSSS, where ZZZZZ = ZIP code, NNNNN = the first 5 consonants of the name, and SSSSS = the first 5 non-blank non-special characters in the street address. |
| Facility Name | The company or permit holder name as maintained in FRS. |
| City | The city where the facility is located, as maintained in FRS. |
| County | The county where the facility is located, as maintained in FRS. |
| State | The two-character state abbreviation where the facility is located, as maintained in FRS. |
| EPA Region | The EPA Region where the facility is located. EPA has 10 regional offices that execute programs within several states and territories. |
| ZIP | The 5- to 9-digit ZIP code where the facility is located. |
| HUC-12 Code | The 12-digit Hydrologic Unit Code (HUC) of the watershed in which the facility resides. |
| DMR Facility Type | The facility ownership classification derived from codes in ICIS-NPDES. Facilities can be classified as publicly owned treatment works (POTW), non-POTW, federal, or state. |
| DMR Industry | The name of the DMR industry sector, based on the 4-digit Standard Industrial Classification (SIC) code. |
| TRI Industry Flag | A Yes/No field to indicate whether the facility is classified within a TRI industry sector. |
| TRI Industry | The name of the TRI Industry sector, based on the 6-digit North American Industry Classification System (NAICS) code. A list of the industry sectors can be found in Linking DMR and TRI Data. |
| DMR Pounds | The total pounds of pollutants discharged by the FRS ID. Pollutant discharge amounts are calculated using DMR data from ICIS-NPDES. |
| DMR TWPE | The total toxic weighted pounds equivalent (TWPE) discharged by the FRS ID. |
| Contains Potential Outlier | A Yes/No field to indicate that DMR Pounds contains loads that are calculated using data that has been flagged as potential outliers or data errors. Y = Yes; Blank = No. |
| TRI Direct Pounds | The TRI-reported direct chemical releases to surface waters in pounds for the FRS ID |
| TRI Direct TWPE | The TRI-reported direct chemical releases to surface waters in toxic weighted pounds equivalent (TWPE) for the FRS ID |
| TRI Indirect Pounds | The TRI-reported indirect chemical releases to POTWs in pounds for the FRS ID |
| TRI Indirect TWPE | The TRI-reported indirect chemical releases to POTWs in toxic weighted pounds equivalent (TWPE) for the FRS ID |
| Link to Multi-Yr Report | Unique URL for each FRS ID to access the Facility Multi-Year Loading Report |
Top Chemicals
The graph displays the DMR and TRI values for the top five chemicals discharged based on the selected metric, chemical universe, and facility universe. For the complete list of chemicals discharges and associated metrics, select Download All Chemicals to download a CSV file. Select Download All Facilities to download a CSV file of all chemical discharges from each facility. The data included are described in the tables below.
Tip: To dig deeper and view multiple years of data by chemical group, use the TRI Search. On the TRI Search Results page, under the Top Chemicals table, click "Compare to DMR."
| Table Column | Description |
|---|---|
| Chemical | The name of the chemical group. For a complete list, see DMR/TRI Chemical Group Crosswalk (XLSX) (102 K) |
| DMR Facility Count | Highest count of FRS IDs reporting DMRs. |
| TRI Facility Count | The highest count of FRS IDs reporting direct discharges to TRI. |
| DMR Pounds | The total pounds of pollutants discharged. Pollutant discharge amounts are calculated using DMR data from ICIS-NPDES. |
| DMR TWPE | The total toxic weighted pounds equivalent (TWPE) discharged. |
| TRI Pounds | The TRI-reported direct chemical releases to surface waters in pounds. |
| TRI TWPE | The TRI-reported direct chemical releases to surface waters in toxic weighted pounds equivalent (TWPE). |
| Table Column | Description |
|---|---|
| FRS ID | Facility Registry Service (FRS) identification number. FRS uniquely identifies a facility by assigning an identification number (FRS ID), and uses this FRS ID to link together all regulatory program database records (such as permit IDs and facility IDs that facilities use in reporting to EPA). |
| NPDES IDs | A unique 9-character ID assigned for each permit within the National Pollutant Discharge Elimination System (NPDES) program. The ID may contain both letters and numbers and often begins with the two-letter abbreviation for the state in which the facility is permitted. |
| TRI FIDs | A unique 15-character ID assigned for each facility within the TRI program. The format is ZZZZZNNNNNSSSSS, where ZZZZZ = ZIP code, NNNNN = the first 5 consonants of the name, and SSSSS = the first 5 non-blank non-special characters in the street address. |
| Facility Name | The company or permit holder name as maintained in FRS. |
| City | The city where the facility is located, as maintained in FRS. |
| County | The county where the facility is located, as maintained in FRS. |
| State | The two-character state abbreviation where the facility is located, as maintained in FRS. |
| EPA Region | The EPA Region where the facility is located. EPA has 10 regional offices that execute programs within several states and territories. |
| ZIP | The 5- to 9-digit ZIP code where the facility is located. |
| HUC-12 Code | The 12-digit Hydrologic Unit Code (HUC) of the watershed in which the facility resides. |
| DMR Facility Type | The facility ownership classification derived from codes in ICIS-NPDES. Facilities can be classified as publicly owned treatment works (POTW), non-POTW, federal, or state. |
| DMR Industry | The name of the DMR industry sector, based on the 4-digit Standard Industrial Classification (SIC) code. |
| TRI Industry Flag | A Yes/No field to indicate whether the facility is classified within a TRI industry sector. |
| TRI Industry | The name of the TRI Industry sector, based on the 6-digit North American Industry Classification System (NAICS) code. A list of the industry sectors can be found in Linking DMR and TRI Data. |
| DMR Pounds | The total pounds of pollutants discharged by the FRS ID. Pollutant discharge amounts are calculated using DMR data from ICIS-NPDES. |
| DMR TWPE | The total toxic weighted pounds equivalent (TWPE) discharged by the FRS ID. |
| Contains Potential Outlier | A Yes/No field to indicate that DMR Pounds contains loads that are calculated using data that has been flagged as potential outliers or data errors. Y = Yes; Blank = No. |
| TRI Direct Pounds | The TRI-reported direct chemical releases to surface waters in pounds for the FRS ID. |
| TRI Direct TWPE | The TRI-reported direct chemical releases to surface waters in toxic weighted pounds equivalent (TWPE) for the FRS ID. |
| TRI Indirect Pounds | The TRI-reported indirect chemical releases to POTWs in pounds for the FRS ID. |
| TRI Indirect TWPE | The TRI-reported indirect chemical releases to POTWs in toxic weighted pounds equivalent (TWPE) for the FRS ID. |
| Link to Multi-Yr Report | Unique URL for each FRS ID to access the Facility Multi-Year Loading Report. |
Known Data Problems
EPA reviewed the dashboard in 2019 to assess its ability to identify TRI filers that report releases of TRI chemicals to surface waters but do not have NPDES permit coverage. These TRI filers are shown in the “No Linked Active NPDES ID” pie slice in the "Facility Universe" box of the dashboard. Based on its analysis, EPA identified several data quality issues in its data systems that should be corrected before the “TRI and DMR Comparison Dashboard” can used to identify discharges potentially not permitted under the Clean Water Act NPDES permit program.
EPA has provided data entry guidance to EPA Regional and state data stewards to help resolve these data quality issues. EPA believes that resolving these data quality issues will help EPA and states more accurately identify facilities with unpermitted surface water discharges. See the following ECHO page for more detailed descriptions on other "Known Data Problems."