Water Quality Indicators Help
Introduction to the Water Quality Indicators Tool (WQI)
The WQI is a screening tool that makes nationwide surface water monitoring data from the Water Quality Portal Exit database for nutrients and several pathogen parameters accessible to the public. The tool plots water monitoring locations and compares the values observed at these locations to a criteria or threshold. Maintained by EPA, this resource integrates multiple sources of data to facilitate the identification of water pollution hotspots as well as other data exploration and analysis.
The WQI can be used to explore:
- Observed surface water monitoring data for nutrients and several pathogen parameters
- Potential upstream contributors
Basic functions within the WQI include:
- Interactive maps
- Filters to limit surface water monitoring data displayed
- Find permitted NPDES facilities upstream and downstream a monitoring location
Using the WQI Tool
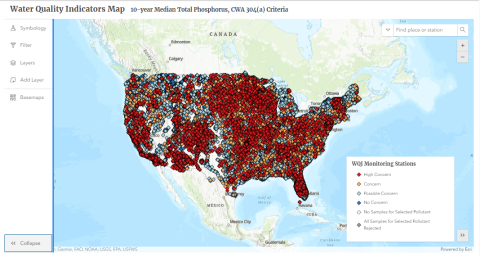
The Water Quality Indicators Map shown below displays a search bar in the top right, with zoom in (+) and zoom out (-) functionality, a map legend on the bottom right, and a side panel menu to the left of the map. The menu allows users to input their search criteria, add layers, and change the underlying basemap. The options reflected in menu are listed below:

Water Monitoring Stations Tab
- Select time interval for the data displayed
- Last 10 years
- Last 4 years
- Select a pollutant to be displayed
- Nutrients
- Total phosphorus
- Total nitrogen
- Pathogens
- E. coli
- Enterococcus
- Fecal coliforms
- Nutrients
- Monitoring Location Summary Statistics- The WQI tool allows the user to select the following statistics comparing reporting ambient monitoring values to the selected criteria:
- Maximum
- Median (default)
- Time weighted median
- 70th percentile
- Time weighted 70th percentile
- 90th percentile
- Time weighted 90th percentile
- Maximum of monthly medians
- Criteria Definition
- Total Nitrogen and Total Phosphorus:
- Clean Water Act (CWA) 304(a) criteria
- Harmful Algal Bloom (HAB) Benchmark (87 µg/L for Total Phosphorus, 1.1 mg /L for Total Nitrogen)
- Yuan, L. L., & Pollard, A. I. (2015). Deriving nutrient targets to prevent excessive cyanobacterial densities in US lakes and reservoirs. Freshwater Biology, 60(9), 1901-1916. Exit
- E. Coli and Enterococci:
- 2012 Recreational Water Quality Criteria (410 CFU/100 mL for E. Coli, 130 CFU/100 mL (STV) for Enterococcus)
- Fecal Coliforms:
- 1976 “Red Book” Recreational and Shellfish Harvesting Criteria (200 CFU/100 mL (log mean))
- All Pollutants:
- User Defined criteria
- User defined pollutant criteria and symbology breakpoints.
- The default breakpoint values are:
- <1x criteria = No Concern (Dark Blue)
- 1<5x criteria = Possible Concern (Light Blue)
- 5<10x criteria = Concern (Orange)
- >10x criteria = High Concern (Red)
- Top 50-500 stations
- WQI will display the stations with the highest monitoring values. This will take into account any user defined filters (e.g. if user filters to the state of Virginia and to stations with a minimum of 10 samples, the WQI will display top 50-500 stations in Virginia with 10 or more samples).
- User Defined criteria
- Total Nitrogen and Total Phosphorus:
- For more information on nutrient pollution, please visit the EPA’s page on nutrient pollution.
Filter
- Geographic Filters
- State
- EPA Region
- Ecoregion (I-XIV)
- Minimum Number of Samples – Allows user to filter out stations displayed by minimum number of monitoring samples (e.g. only display monitoring stations that have five or more monitoring samples).
- Monitoring Station Category – This filter allows a user select only certain monitoring stations be displayed (e.g. only view red and orange monitoring stations).
- High Concern (Red Stations)
- Concern (Orange Stations)
- Possible Concern (Light Blue Stations)
- No Concern (Dark Blue Stations)
- All Samples for Selected Pollutant Rejected (Grey Stations) – Monitoring stations where all the recorded samples for the selected pollutant did not pass the data quality screening protocol.
- No Samples for Selected Pollutant – Displays existing monitoring stations in the Water Quality Portals data.
- Water Body Type
- Stream/River
- Lake/Reservoir
- Saltwater (only for E. Coli, Enterococci, and Fecal Coliform)
- HUC-8 Subbasin – Allows the user to select and zoom to a given Hydrologic Unit Code-8 Subbasin. To use this selection, a user must first select an Ecoregion or EPA Region.
Layer List
- WQI Data
- Water Quality Indicators Monitoring Stations
- Pollutant Change - Upstream / Downstream Analysis Layer that identify river and stream segments where a changes of 25% or greater were observed.
- Pathogens Δ (Increase/Decrease) 10 Yr
- Pathogens Δ (Increase/Decrease) 4 Yr
- Total Nitrogen Δ (Increase/Decrease) 10 Yr
- Total Nitrogen Δ (Increase/Decrease) 4 Yr
- Total Phosphorus Δ (Increase/Decrease) 10 Yr
- Total Phosphorus Δ (Increase/Decrease) 4 Yr
- Multi-Pollutant Δ (Increase Only) 10 Yr
- Multi-Pollutant Δ (Increase Only) 4 Yr
- Facility Data
- NPDES Permitted Facilities – This layer from EPA's Enforcement and Compliance History Online (ECHO) includes facilities regulated as Clean Water Act (CWA) dischargers.
- NPDES Discharge Points - This layer (also called permitted features) from ECHO presents discharge points for permitted NPDES facilities.
- NPDES SNC Facilities - This layer from ECHO presents NPDES facilities currently in significant non-compliance status.
- Non-NPDES Facilities - This layer from EPA's ECHO includes facilities not regulated under the CWA.
- Water Data
- Assessed and Impaired Waters (ATTAINS) - This layer depicts where state water quality assessment decisions reported to EPA under CWA Sections 303(d) and 305(b).
- National Hydrography Dataset Plus (NHD+) Flow Lines* - This layer contains arrows to illustrate the flow direction of rivers and streams indexed to NHDPlus.
- HUC 8, 10, and 12* – This EPA Office of Water hosted web service contains a polygon layer depicting the Watershed Boundary Dataset (WBD)Exit - from NHDPlus. HUC level presented adjusts to zoom level (e.g., national view will display HUC 12 watersheds and zoomed to a state view will display HUC 8 watershed).
- Land Cover Data
- National Land Cover Database (NLCD) Exit- This layer presents land cover classifications at a resolution of 30 meters for the United States indexed to the National Land Cover Database 2021.
- Chesapeake Bay Land Use Land Cover (LULC) Exit- This layer was created by the Chesapeake Conservancy and presents land cover classifications for the Chesapeake Bay watershed at a resolution of 1 meter.
*User must zoom in to an appropriate level to view the features of this layer.
Add Layer

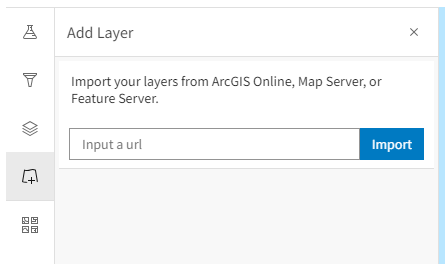
The Add Data feature allows users to temporarily add data to the map by searching for layers in ArcGIS online for ArcGIS content, entering URLs, or uploading files from your desktop. Users can temporarily add layers to the map; however, data layers cannot be saved to the WQI map interface. Added data layers will only be visible to the user that added the data and will not be visible to separate users.
Esri provides access to many geospatial layers through ArcGIS Online. WQI users may add publicly-available and licensed data services available on ArcGIS Online or the EPA GeoPlatform by adding the service URL into the URL text box and clicking IMPORT.
Sample URL:
Map of ICIS-NPDES Wastewater Treatment Plants: https://geodata.epa.gov/arcgis/rest/services/OEI/FRS_Wastewater/MapServ…
Basemaps
You can control how your map looks by adjusting the base layer. Topography is selected by default, though the WQI contains a number of basemap options.
Documentation/More Information
- Water Quality Indicators (WQI) Project Background and Technical Specifications (PDF) (384kb)- this file provides documentation on the WQI data processing algorithm.
- Data Processing Summary - a data visualization dashboard that provides a summary of data used in the WQI can be found on the Water Quality Indicators Data Usability Improvement Project page.
- WQI Data Download - download the current and historical WQI data files.
