Hierarchy of Loading Calculations
The Loading Tool calculates DMR pollutant loadings using the days in a monitoring period, a quantity or concentration value, and, as needed, the corresponding wastewater discharge flow. These data are reported by NPDES permittees on the Discharge Monitoring Report or "DMR." The DMR form has two quantity and three concentration data fields (i.e., five measurement value fields):
- Quantity 1 (kg/day)
- Quantity 2 (kg/day)
- Concentration 1 (mg/L)
- Concentration 2 (mg/L)
- Concentration 3 (mg/L)
The quantity measurement fields may represent average, maximum, or total values, while the concentration measurement fields may represent minimum, average, or maximum values. Facilities may use a variety of measurements to populate the above five measurement value fields. For example, a facility can use a monthly average, daily average, 30 day geometric average, etc. to represent the average quantity. The DMR data contain statistical base codes (CSV) to indicate the types of measurements reported.
EPA's goal for calculating pollutant loads is to characterize the average pollutant mass discharges to receiving streams; therefore, the Loading Tool selects the appropriate DMR measurement data field using a hierarchy that gives priority to the average values. Calculating annual pollutant loadings using concentrations requires the use of wastewater flow data, which increases the uncertainty of the calculation. Therefore, the Loading tool measurement selection hierarchy generally prioritizes average quantities over average concentrations.
The only exception to this rule is if the limit is on a concentration basis and there is no corresponding mass-based quantity limit. In this case, the loading tool will prioritize concentrations over quantities. In order to calculate the load over limit estimates, the Loading Tool selects the same DMR measurement as either the permit limit or enforcement action limit, which could be either a concentration or quantity. Although the pollutant loadings are calculated by prioritizing measurements that are the same measurement as the limit, average measurements are still prioritized over minimum, total, and/or maximum measurements.
Pollutants in facility wastewater discharges are typically measured at regular intervals called monitoring periods (e.g., monthly, quarterly). After the Loading Tool selects the appropriate measurement values, the following values are calculated for each pollutant at individual outfalls (discharge points) at the facility over a monitoring period:
- Average Daily Load (kg/day);
- Average Concentration (mg/L); and
- Average Wastewater Flow (Million Gallons/day or MGD).
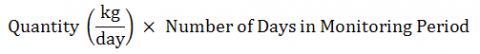
The Loading Tool then calculates the following values for each monitoring period, assuming that the discharge occurs continuously for the duration of the monitoring period. Note that for intermittent discharges reported in DMRs, the Loading Tool adjusts the number of days in the monitoring period using the duration of discharge parameter. The following general equations are used to calculate the load discharged during a monitoring period:
Monitoring Period Load (kg/monitoring period)
or
Monitoring Period Wastewater Flow (MG/monitoring period)
Load Over Limit Calculations
Where either permit limits or enforcement action limits are available, the Loading Tool calculates the Load Over Limit (LOL) for the combination of outfall, monitoring period, and pollutant. LOL calculations are provided in the results of Custom Search and displayed in the Effluent Limit Exceedances Search. As noted above, for each permit, outfall, monitoring period, and parameter, the Loading Tool uses a hierarchy to identify the DMR values and corresponding effluent limits for pollutant loading and LOL calculations. In general, the hierarchy for selecting DMR values for pollutant loading and LOL calculations is to prioritize monthly average DMR values or next closest measure of the average pollutant discharge. The hierarchy also prioritizes average quantity DMR values (i.e., Quantity 2) over average concentration DMR values (i.e., Concentration 2) as pollutant loading and LOL calculations using average quantity DMR values do not need to incorporate wastewater discharge flow data.
Key considerations:
- Load over Limit is calculated for each monitoring period (e.g., month, quarter). The difference between the average load and permitted load for each monitoring period are then summed to generate an Annual Load over Limit (kg/year).
- Load over Limit is blank for parameters that have requirements to monitor (i.e., measure) discharges, but do not have numeric limits.
- Load over Limit represents reported data. The Load over Limit is not estimated for monitoring periods where no data is reported.
- Load over Limit is not calculated for average concentration DMR values that are covered by average quantity DMR values. For example, there are no LOL calculations based on monthly average concentration data (i.e., Concentration 2) when there are also monthly average quantity data (i.e., Quantity 1) for same permit, outfall, parameter, and monitoring period.
- Load over Limit is not calculated for average DMR values that are covered by another average DMR values. For example, there are no LOL calculations based on weekly average concentration data when there are also monthly average concentration data.
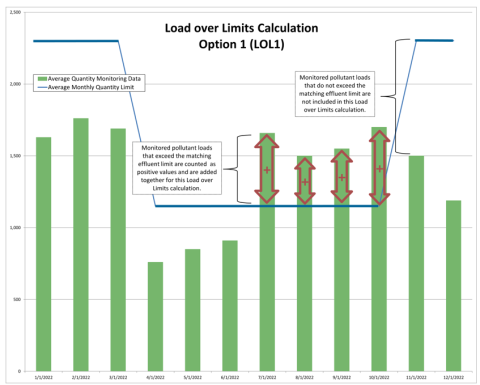
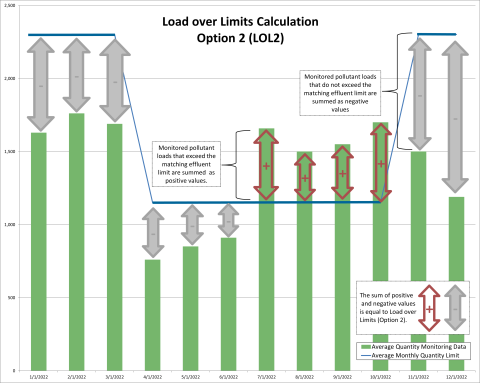
This calculation is done by summing the monthly differences between the average load and the permit limit in two ways, as illustrated by Figures 1 and 2 below. Both options subtract the DMR measurement value from the corresponding limit value. Option 1 sets any negative differences equal to zero, while Option 2 retains the calculated negative value.
The following examples demonstrate how the Load over Limit is calculated, using loadings data from the Facility Loading Calculations monitoring period table. See Section 3.2 of the Technical Users Background Document for the Water Pollutant Loading Tool for more specific information on the calculations.
![]() - Indicates there was one or more exceedances of permit effluent limits for this pollutant during the reporting year.
- Indicates there was one or more exceedances of permit effluent limits for this pollutant during the reporting year.
| Monitoring Period | Discharge Information | Below Detection Limit? | Measurement Type | Avg Daily Value | Limit | Wastewater Flow (MGD) | Number of Days | Monitoring Period Load (lb/period) | Load Equation | Daily Load Over Limit (lb/day)1 | LOL Option 1 (lb)2 | LOL Option 2 (lb)2 |
|---|---|---|---|---|---|---|---|---|---|---|---|---|
| 1/31/2014 | Occurred? Yes | No | Quantity (kg/day) | 2.54 | 21.2 | 0.16 | 31 | 174 | Daily Load (kg/day) * Number of Days * 2.205 (lb/kg) | -18.66 | 0 | -578.46 |
| Reported? Yes | ||||||||||||
| Estimated? No | ||||||||||||
| 2/28/2014 | Occurred? Yes | No | Quantity (kg/day) | 2.408 | 21.2 | 0.15 | 28 | 149 | Daily Load (kg/day) * Number of Days * 2.205 (lb/kg) | -18.792 | 0 | -526.176 |
| Reported? Yes | ||||||||||||
| Estimated? No | ||||||||||||
| 3/31/2014 | Occurred? Yes | No | Quantity (kg/day) | 3.047 | 21.2 | 0.14 | 31 | 208 | Daily Load (kg/day) * Number of Days * 2.205 (lb/kg) | -18.153 | 0 | -562.743 |
| Reported? Yes | ||||||||||||
| Estimated? No | ||||||||||||
| 4/30/2014 | Occurred? Yes | No | Quantity (kg/day) | 3.68 | 7.074 | 0.14 | 30 | 244 | Daily Load (kg/day) * Number of Days * 2.205 (lb/kg) | -3.394 | 0 | -101.82 |
| Reported? Yes | ||||||||||||
| Estimated? No | ||||||||||||
| 5/31/2014 | Occurred? Yes | No | Quantity (kg/day) | 3.011 | 7.074 | 0.13 | 31 | 206 | Daily Load (kg/day) * Number of Days * 2.205 (lb/kg) | -4.063 | 0 | -125.953 |
| Reported? Yes | ||||||||||||
| Estimated? No | ||||||||||||
| 6/30/2014 | Occurred? Yes | No | Quantity (kg/day) | 2.33 | 7.074 | 0.11 | 30 | 155 | Daily Load (kg/day) * Number of Days * 2.205 (lb/kg) | -4.744 | 0 | -142.32 |
| Reported? Yes | ||||||||||||
| Estimated? No | ||||||||||||
| 7/31/2014 | Occurred? No | No | Quantity (kg/day) | 7.074 | 0 | 31 | No Load Calculated | |||||
| Reported? Yes | ||||||||||||
| Estimated? No | ||||||||||||
| 8/31/2014 | Occurred? No | No | Quantity (kg/day) | 7.074 | 0 | 31 | No Load Calculated | |||||
| Reported? Yes | ||||||||||||
| Estimated? No | ||||||||||||
| 9/30/2014 | Occurred? No | No | Quantity (kg/day) | 7.074 | 0 | 30 | No Load Calculated | |||||
| Reported? Yes | ||||||||||||
| Estimated? No | ||||||||||||
| 10/31/2014 | Occurred? Yes | No | Quantity (kg/day) | 0.71 | 21.2 | 0.17 | 31 | 48.67 | Daily Load (kg/day) * Number of Days * 2.205 (lb/kg) | -20.49 | 0 | -635.19 |
| Reported? Yes | ||||||||||||
| Estimated? No | ||||||||||||
| Annual Load from Monitoring Data (lb/yr) | 1,184.67 | Annual Load over Limit (lb/yr) | 0 | -2,672.66 | ||||||||
| Monitoring Period | Discharge Information | Below Detection Limit? | Measurement Type | Avg Daily Value | Limit | Wastewater Flow (MGD) | Number of Days | Monitoring Period Load (lb/period) | Load Equation | Daily Load Over Limit (lb/day)1 | LOL Option 1 (lb)2 | LOL Option 2 (lb)2 |
|---|---|---|---|---|---|---|---|---|---|---|---|---|
| 1/31/2014 | Occurred? Yes | No | Quantity (kg/day) | 0.72 | 2.22 | 0.076 | 31 | 49.6 | Daily Load (kg/day) * Number of Days * 2.205 (lb/kg) | -1.5 | 0 | -46.5 |
| Reported? Yes | ||||||||||||
| Estimated? No | ||||||||||||
| 2/28/2014 | Occurred? Yes | No | Quantity (kg/day) | 1.67 | 2.22 | 0.11 | 28 | 104 | Daily Load (kg/day) * Number of Days * 2.205 (lb/kg) | -0.55 | 0 | -15.4 |
| Reported? Yes | ||||||||||||
| Estimated? No | ||||||||||||
| 3/31/2014 | Occurred? Yes | No | Quantity (kg/day) | 0.72 | 2.22 | 0.11 | 31 | 49.6 | Daily Load (kg/day) * Number of Days * 2.205 (lb/kg) | -1.5 | 0 | -46.5 |
| Reported? Yes | ||||||||||||
| Estimated? No | ||||||||||||
| 4/30/2014 | Occurred? Yes | No | Quantity (kg/day) | 0.86 | 2.22 | 0.0906 | 30 | 57 | Daily Load (kg/day) * Number of Days * 2.205 (lb/kg) | -1.36 | 0 | -40.8 |
| Reported? Yes | ||||||||||||
| Estimated? No | ||||||||||||
| 5/31/2014 | Occurred? Yes | No | Quantity (kg/day) | 0.68 | 2.22 | 0.103 | 31 | 46.5 | Daily Load (kg/day) * Number of Days * 2.205 (lb/kg) | -1.54 | 0 | -47.74 |
| Reported? Yes | ||||||||||||
| Estimated? No | ||||||||||||
| 6/30/2014 | Occurred? Yes | No | Quantity (kg/day) | 0.72 | 2.22 | 0.101 | 30 | 48 | Daily Load (kg/day) * Number of Days * 2.205 (lb/kg) | -1.5 | 0 | -45 |
| Reported? Yes | ||||||||||||
| Estimated? No | ||||||||||||
| 7/31/2014 | Occurred? Yes | No | Quantity (kg/day) | 0.81 | 2.22 | 0.091 | 31 | 55.8 | Daily Load (kg/day) * Number of Days * 2.205 (lb/kg) | -1.41 | 0 | -43.71 |
| Reported? Yes | ||||||||||||
| Estimated? No | ||||||||||||
| 8/31/2014 | Occurred? Yes | No | Quantity (kg/day) | 1.088 | 2.22 | 0.102 | 31 | 74.4 | Daily Load (kg/day) * Number of Days * 2.205 (lb/kg) | -1.132 | 0 | -35.092 |
| Reported? Yes | ||||||||||||
| Estimated? No | ||||||||||||
| 9/30/2014 | Occurred? Yes | No | Quantity (kg/day) | 3.038 | 2.22 | 0.1004 | 30 | 201 | Daily Load (kg/day) * Number of Days * 2.205 (lb/kg) | 0.818 | 24.54 | 24.54 |
| Reported? Yes | ||||||||||||
| Estimated? No | ||||||||||||
| 10/31/2014 | Occurred? Yes | No | Quantity (kg/day) | 0.77 | 2.22 | 0.078 | 31 | 52.7 | Daily Load (kg/day) * Number of Days * 2.205 (lb/kg) | -1.45 | 0 | -44.95 |
| Reported? Yes | ||||||||||||
| Estimated? No | ||||||||||||
| 11/30/2014 | Occurred? Yes | No | Quantity (kg/day) | 0.77 | 2.22 | 0.093 | 30 | 51 | Daily Load (kg/day) * Number of Days * 2.205 (lb/kg) | -1.45 | 0 | -43.5 |
| Reported? Yes | ||||||||||||
| Estimated? No | ||||||||||||
| Annual Load from Monitoring Data (lb/yr) | 789 | Annual Load over Limit (lb/yr) | 24.54 | -384.652 | ||||||||
| Monitoring Period | Discharge Information | Below Detection Limit? | Measurement Type | Avg Daily Value | Limit | Wastewater Flow (MGD) | Number of Days | Monitoring Period Load (lb/period) | Load Equation | Daily Load Over Limit (lb/day)1 | LOL Option 1 (lb)2 | LOL Option 2 (lb)2 |
|---|---|---|---|---|---|---|---|---|---|---|---|---|
| 1/31/2014 | Occurred? No | No | Concentration (mg/L) | 6.2 | 0 | 31 | No Load Calculated | |||||
| Reported? Yes | ||||||||||||
| Estimated? No | ||||||||||||
| 2/28/2014 | Occurred? No | No | Concentration (mg/L) | 6.2 | 0 | 28 | No Load Calculated | |||||
| Reported? Yes | ||||||||||||
| Estimated? No | ||||||||||||
| 3/31/2014 | Occurred? Yes | No | Concentration (mg/L) | 6.3 | 6.2 | 30 | 31 | 48,899 | Concentration (mg/L) * Flow (MGD) * 3.785 (L/gal) * Number of Days * 2.205 (lb/kg) | 25 | 776 | 776 |
| Reported? Yes | ||||||||||||
| Estimated? No | ||||||||||||
| 4/30/2014 | Occurred? No | No | Concentration (mg/L) | 6.2 | 0 | 30 | No Load Calculated | |||||
| Reported? Yes | ||||||||||||
| Estimated? No | ||||||||||||
| 5/31/2014 | Occurred? Yes | No | Concentration (mg/L) | 6.8 | 6.2 | 32 | 31 | 56,298 | Concentration (mg/L) * Flow (MGD) * 3.785 (L/gal) * Number of Days * 2.205 (lb/kg) | 160 | 4,967 | 4,967 |
| Reported? Yes | ||||||||||||
| Estimated? No | ||||||||||||
| 6/30/2014 | Occurred? Yes | No | Concentration (mg/L) | 7.2 | 6.2 | 29 | 30 | 52,279 | Concentration (mg/L) * Flow (MGD) * 3.785 (L/gal) * Number of Days * 2.205 (lb/kg) | 242 | 7,261 | 7,261 |
| Reported? Yes | ||||||||||||
| Estimated? No | ||||||||||||
| 7/31/2014 | Occurred? No | No | Concentration (mg/L) | 6.2 | 0 | 31 | No Load Calculated | |||||
| Reported? Yes | ||||||||||||
| Estimated? No | ||||||||||||
| 8/31/2014 | Occurred? No | No | Concentration (mg/L) | 6.2 | 0 | 31 | No Load Calculated | |||||
| Reported? Yes | ||||||||||||
| Estimated? No | ||||||||||||
| 9/30/2014 | Occurred? Yes | No | Concentration (mg/L) | 8.3 | 6.2 | 25 | 30 | 51,953 | Concentration (mg/L) * Flow (MGD) * 3.785 (L/gal) * Number of Days * 2.205 (lb/kg) | 438 | 13,145 | 13,145 |
| Reported? Yes | ||||||||||||
| Estimated? No | ||||||||||||
| Annual Load from Monitoring Data (lb/yr) | 209,429 | Annual Load over Limit (lb/yr) | 26,149 | 26,149 | ||||||||
1 Daily Load Over Limit (lb/day) = Average Daily Value - Limit Value
2 Load Over Limit = Daily Load Over Limit * Number of Days
Display of Load over Limit Calculations on Effluent Limit Exceedances Report
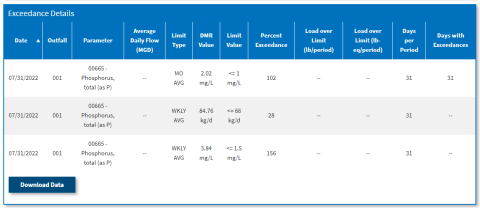
The Effluent Limit Exceedances Search allows you to search, sort, and drilldown on effluent limit exceedances (i.e., reported DMR values that exceed effluent limits). The drilldown report associated with this search - the "Effluent Limit Exceedances Report" (see example) presents LOL1 calculations for "pounds" and "toxic pounds." It is important to note that the LOL1 calculations can be null for an effluent exceedance as show in the figure below. This will occur when the parameter cannot be expressed as a load (e.g., pH, color) and when the reported DMR value with an effluent limit exceedance is not used in the pollutant loading or LOL calculations.
For the example shown below, the facility reported four DMR values for the same outfall (001), same monitoring period end date (7/31/22), and same parameter [00665 - Phosphorus, total (as P)]. Three of these DMR values had effluent limit exceedances and are show on the "Effluent Limit Exceedances Report." However, the monthly average quantity value was the DMR value used for the pollutant loading calculation and LOL calculations and this value (45.3 kg/d) was less than the effluent limit (53 kg/d). Consequently, the monthly average quantity value is not shown on the "Effluent Limit Exceedances Report" and the LOL values are null for the other three phosphorus parameters in this exceedances report.